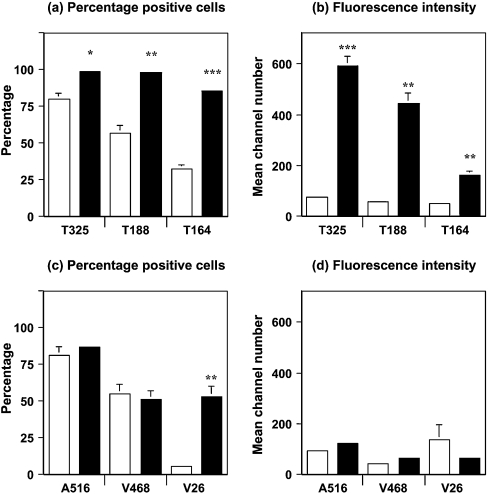
Figure 10. Quantification of N- and C-terminal PrP flow cytometric analysis.
(a) Percentage of positive cells (means±S.D.) and (b) mean channel number (means±S.D.) are shown for PBMCs from scrapie-infected sheep at 7 months p.i. (black bar) (n=3) and age-matched scrapie-free control sheep (white bar) (n=4) stained with N-terminal-specific anti-PrP monoclonal antibodies T325, T188 and T164. (c) Percentage of positive cells (means±S.D.) and (d) mean channel number (means±S.D.) are shown for PBMCs from scrapie-infected sheep at 7 months p.i. (black bar) (n=3) and age-matched scrapie-free control sheep (white bar) (n=4) stained with C-terminal-specific anti-PrP monoclonal antibodies A516, V468 and V26. Statistical analysis of the data in Figure 10 (comparison with scrapie-free equivalent): *P<0.05, **P<0.01 and ***P<0.001.

