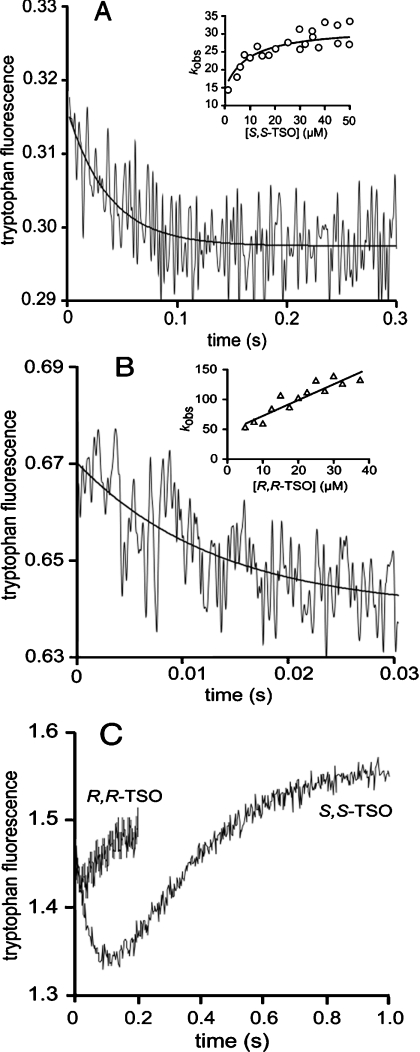
Figure 1. Tryptophan fluorescence traces.
Tryptophan fluorescence traces of (A) 0.5 μM StEH1-5H and 5 μM S,S-TSO or (B) 1 μM StEH1-5H and 20 μM R,R-TSO. The solid lines represent the fits of a single exponential decay applied to extract apparent rate constants kobs. The insets show the fits of eqn (2a) (A) or eqn (2c) (B) to the substrate dependences of kobs. (C) Single turnover experiments of 5 μM StEH1-5H and 4 μM R,R-TSO and 5 μM StEH1-5H and 4 μM S,S-TSO. All reactions were followed at 30 °C in 0.1 M sodium phosphate buffer (pH 6.8).

