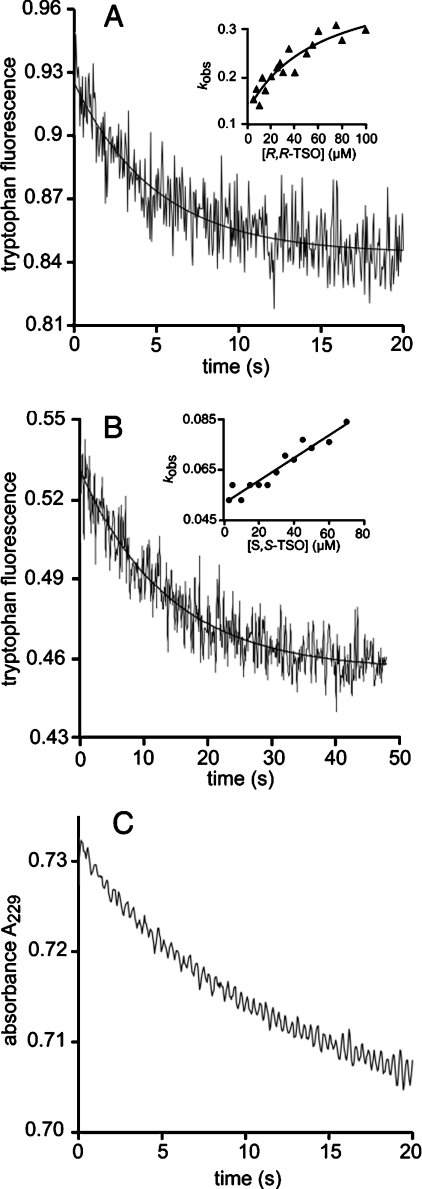
Figure 2. Tryptophan fluorescence traces.
Tryptophan fluorescence traces of (A) 1.1 μM H300N and 20 μM R,R-TSO and (B) 0.8 μM H300N and 5 μM S,S-TSO. The solid curves represent the fits of a single exponential decay applied to extract apparent rate constants kobs. The insets in (A) and (B) show the fits of eqns (2a) and (2c) respectively to the substrate dependence of kobs. (C) Hydrolysis of 20 μM R,R-TSO catalysed by 2.5 μM H300N, detected as disappearance of the epoxide at 229 nm. All reactions were followed at 30 °C in 0.1 M sodium phosphate buffer (pH 6.8).

