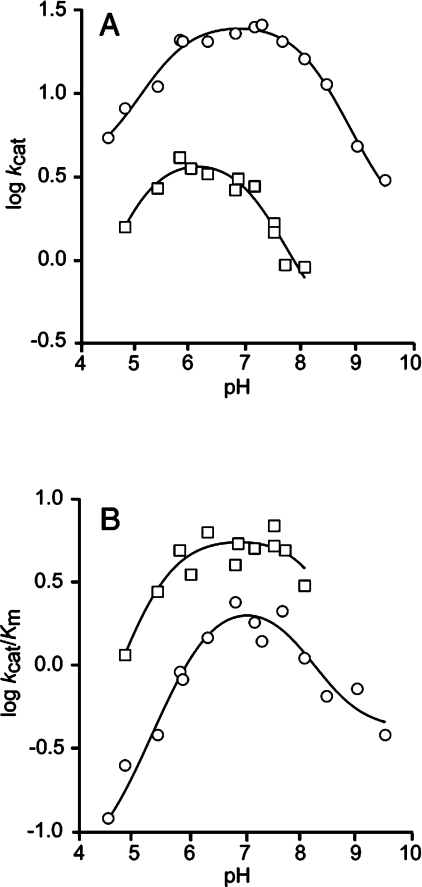
Figure 3. Effects of pH on (A) kcat and (B) kcat/Km of StEH1-5H.
The effects of pH on (A) kcat and (B) kcat/Km of StEH1-5H were determined by measuring initial rates of the catalysed reactions at different pH values with R,R-TSO (○) or S,S-TSO (□) at 30 °C. The lines represent the fits of eqn (3) to the data yielding the pKa values (Table 5).

