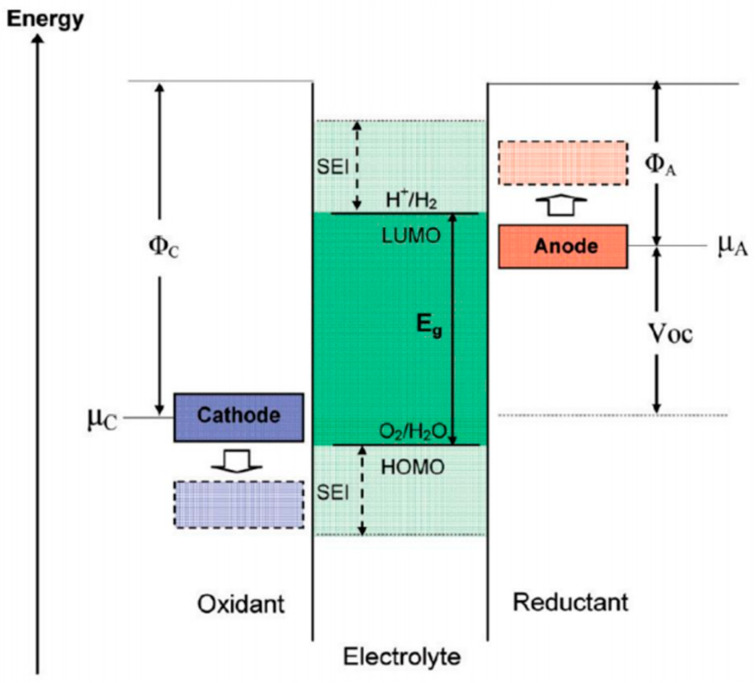
Figure 1.
Energy diagram of open circuit potential of electrolyte, where ΦA and ΦC are the conduction functions of the anode and cathode in the circuit. Eg is the band gap. μA and μC are the REDOX potentials of the anode and cathode, respectively [23].

