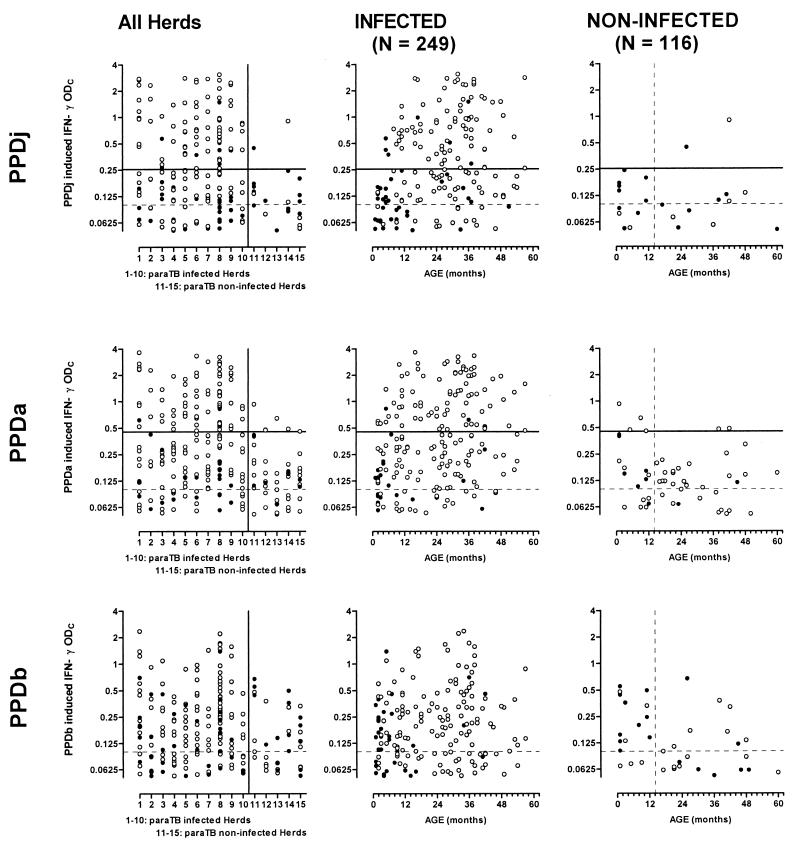
FIG. 3.
Individual IFN-γ responses in herds infected or not infected with paraTB following whole-blood stimulation with PPDj, PPDa, or PPDb. Responses are presented as ODC responses following specific stimulation minus no-antigen stimulation. Open circles indicate PPDj > PPDb in the top panel or PPDa > PPDb in the lower two panels. Closed circles indicate PPDb responses greater than or equal to the PPDj or PPDa response, respectively. The broken horizontal line at ODC = 0.1 indicates the standard cutoff level at test interpretation for bovine paraTB or TB (bottom panel). The solid horizontal lines at 0.254 and 0.453 indicate the estimated 95% paraTB cutoff points for interpretation of PPDj or PPDa responses, respectively. Only IFN-γ ODC levels of greater than 0.05 are shown; thus, e.g., results for 80 and 93 PPDj-stimulated animals in the infected and noninfected herds, respectively, are not shown (Table 2).

