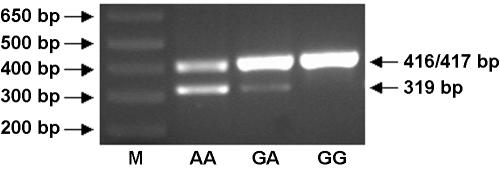
Figure 2.
Expression of OAS1 p46, p48, and p52 in interferon-α–stimulated human cells. M = molecular-weight standard. Lane 1, AA genotype; lane 2, GA genotype; and lane 3, GG genotype. RT-PCR primers were designed to amplify cDNA segments of sizes 417 bp and 319 bp, corresponding to the p46 and p48 splice variants, respectively. Unexpectedly, the primers also amplified a 416-bp segment, corresponding to a novel p52 variant (see text). Results produced by use of nonstimulated cells were qualitatively similar, but bands were fainter.

