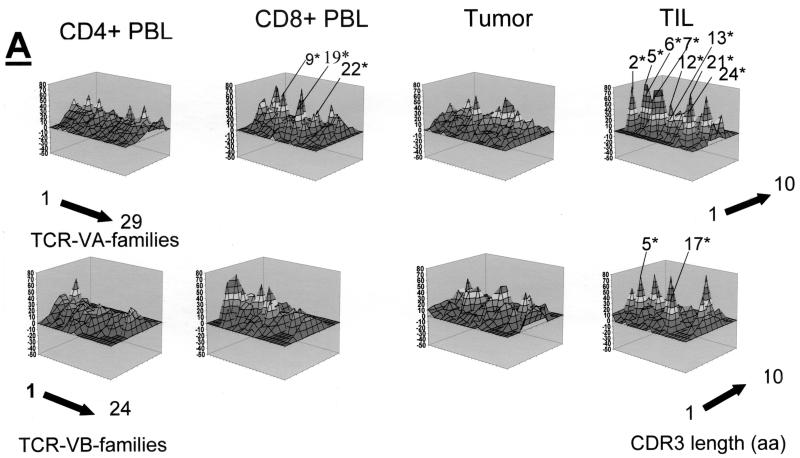
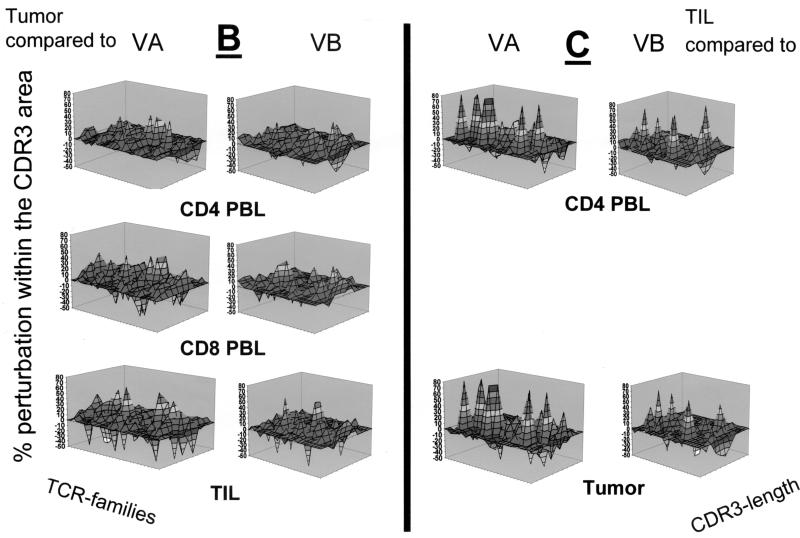
FIG. 2.
Qualitative assessment of the TCR repertoire in patient MZ-CC01-1. (A) TCR VA and VB landscape in PBL, freshly harvested tumor, and TIL. Monoclonal TCRs (listed in Table 2) are indicated by asterisks. Each shade represents 10% of the area under the curve in each individual VA (n = 29) or VB (n = 24) family. (B) Perturbation analysis of the TCR VA and VB repertoire in the tumor specimen compared to CD4+ and CD8+ PBL or CD4+ TIL. Each shade represents a 10% difference in the area under the curve in individual CDR3 peaks. An unperturbed (i.e., identical) repertoire would represent a smooth surface. Differences are shown as 10% over- or underrepresentation of VA and VB family peaks. (C) Perturbation analysis in CD4+ TIL compared to CD4+ PBL or tumor tissue. aa, amino acids.


