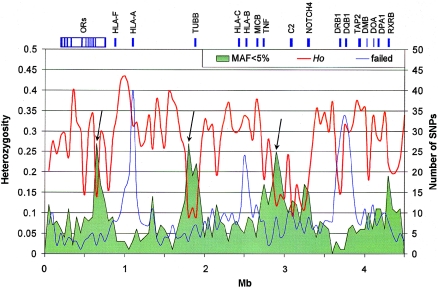
Figure 1.
Low-heterozygosity regions in the MHC. The observed heterozygosity (“Ho,” red line) averaged in 50-kb windows is plotted with the number of loci with MAF <5% (green area). SNPs showing MAF <5% are not randomly distributed across the analyzed 4.459-Mb region. Specifically, three regions (black arrows) presented loss of heterozygosity; most SNPs are monomorphic in this population. These fragments contain OR2H1 and MAS1L; DHX16, NRM, MDC1 TUBB, and FLOT1; BAT5, LY6GD, C6orf25, DDAH2, C6orf26, and VARS2, respectively. The uneven distribution of the 770 SNPs that failed to generate genotyping data is represented by the blue line (“failed,” number of SNPs in 50-kb windows). Typing failures are concentrated mainly in three genomic regions (blue peaks), including HLA-A, HLA-B, HLA-C, HLA-DQB1, and HLA-DRB1, which suggests that the highly polymorphic nature of these genes might be responsible for the failure.

