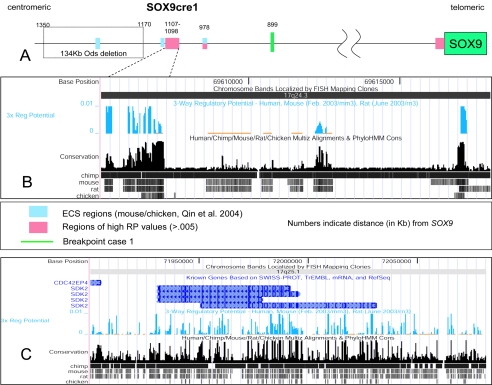
Figure 5.
Computer analysis of the regulatory elements around SOX9. A, Graphical representation of the region ∼1.35 Mb upstream of SOX9. The evolutionary conserved sequences (ECS) regions described by Qin et al. (2004) and the nearby region of high RP values are shown as blue and pink boxes, respectively. B, A more detailed view of the region of high RP values, with the UCSC Genome Browser map of three-way (human, mouse, and rat) RP analysis of the candidate cis-regulatory element SOX9cre1, ∼1.1 Mb upstream of SOX9. The presence of such an element has been hypothesized elsewhere (Pfeifer et al. 1999; Bagheri-Fam et al. 2001; Pop et al. 2004; Qin et al. 2004). C, UCSC map of the region surrounding the downstream breakpoint within the SDK2 gene in 17q25.1. There are several regions of high RP scores throughout the breakpoint area, signifying areas of potential regulatory elements of SOX9. Most RP peaks fall outside coding regions. BLAST results of SOX9cre1 suggest that this may be a pseudogene of the PAI-1 mRNA binding protein from chromosome 1. PhyloHMM Cons = phylogenetic hidden Markov model. URLs for SWISS-PROT, TrEMBL, and RefSeq can be found in the Electronic-Database Information section. For information on Multiz, see Blanchette et al. (2004).

