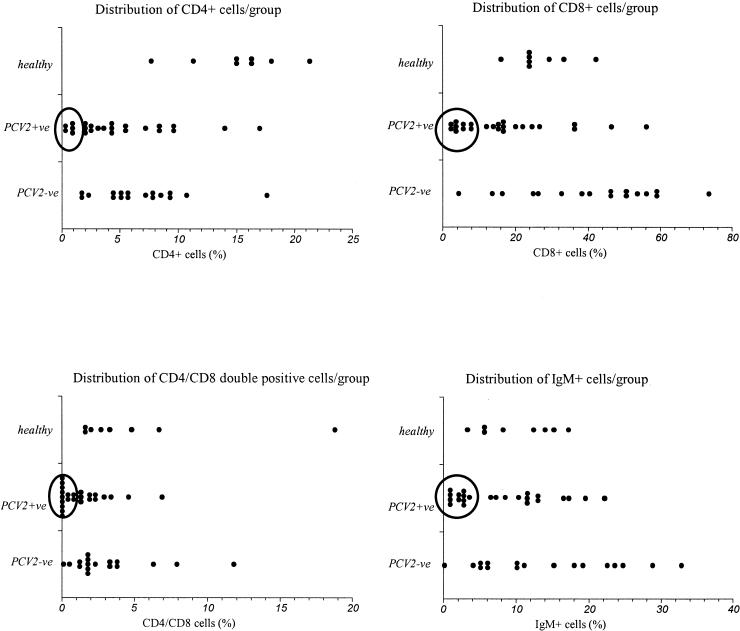
FIG. 3.
Distribution of individual results (percentage of cells for each animal) with respect to the different lymphocyte subsets. The large open circles comprise the clusters of pigs with the lowest relative proportions of peripheral blood lymphocyte subsets, pigs that thereby differ from the other pigs in the study. +ve, positive; −ve, negative.

