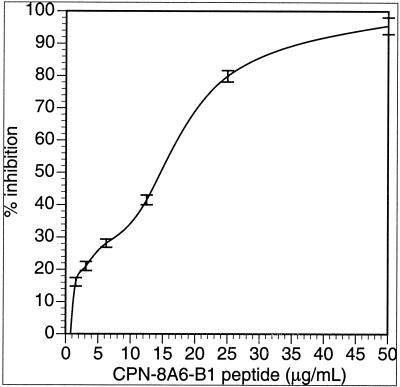
FIG. 2.
Inhibition plot of 8A6 MAb reactivity to C. pneumoniae in the presence of peptide CP-8A6-B1. The plot shows the mean percent inhibition of two independent assays each having three wells per peptide concentration (each error bar represents one standard deviation) compared to peptide-free wells.

