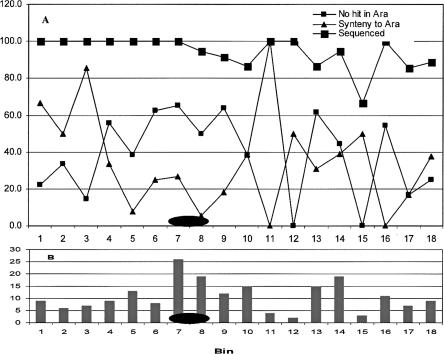
Figure 6.
(A) Percentage of sequenced loci, loci showing conserved synteny between cotton and Arabidopsis α duplicates, and loci showing no orthologs in Arabidopsis. (B) Total mapped locus number in 10-cM bins along cotton consensus map C02 (a typical example). Ellipses represent possible location of centromeres, inferred as described elsewhere (Rong et al. 2004).

