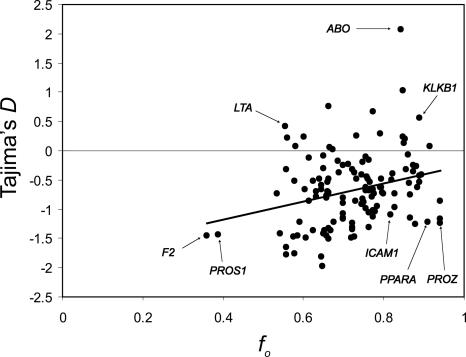
Figure 3.
A plot of Tajima's D versus f̂0 predictions. The observed frequency distribution is increasingly skewed toward an excess of rare alleles as predicted variation is reduced (assuming background selection). This could be a result of either positive or negative selection or both. The correlation between Tajima's D and f̂0 remains significant even if the apparent outliers (ABO, F2, and PROS1) are selectively removed (r2 = 0.045, P = 0.019). Note, if a linear extrapolation is made from the best-fit regression line to f0 = 1, in an effort to account for the effects of selection, there is little to no negative skew (D ≈ 0) predicted for humans, consistent with a nearly constant ancestral population size.

