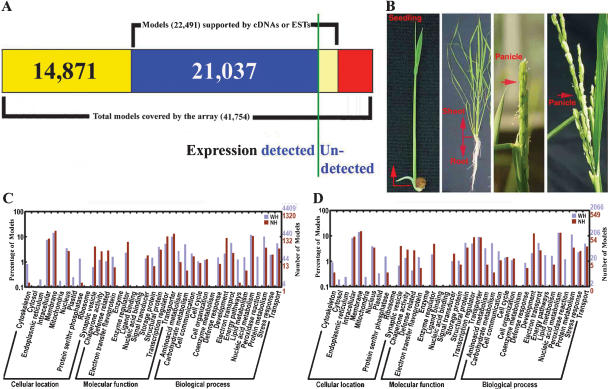
Figure 1.
Microarray expression analysis of confirmed and predicted gene models in the rice genome. (A) Summary of full-length cDNA-confirmed, EST-supported, and total-predicted gene models covered by the 70-mer oligo microarray used in this study. The vertical green line separates the relative proportions of gene models whose expressions are confirmed or not in our analysis. (B) Rice organ-sample collection used for microarray analysis. (C,D) GO categories of gene models expressed in at least one organ or in cultured cells (C) and in all collected organs and cultured cells (D). The details for gene models included in C and D can be found in Supplemental Tables 3 and 4, respectively.

