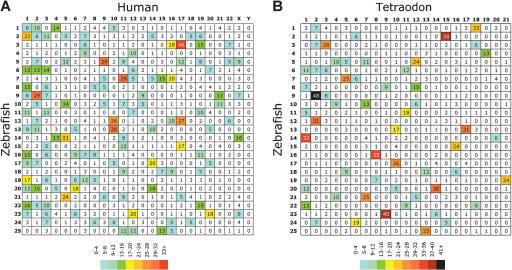
Figure 2.
Oxford grids showing conservation of synteny among zebrafish, human, and Tetraodon. These grids plot the locations of orthologous gene pairs according to their chromosomal positions in the two compared species. The number in each square in the grids is the number of orthologous gene pairs on the indicated chromosomes in the two compared species. Boxes in the grid that contain large numbers identify conserved syntenies involving many genes. (A) Zebrafish-human comparison. (B) Zebrafish-Tetraodon comparison. Human orthologs of mapped zebrafish genes are listed in Supplemental Table 2, and Tetraodon orthologs of mapped zebrafish genes are listed in Supplemental Table 3. Both grids clearly show a nonrandom distribution of clusters (for details, see text), with particular chromosome pairs showing high degrees of conserved synteny. Map positions for zebrafish genes were derived from this work, and those of Tetraodon were obtained from http://www.ensembl.org/Tetraodon_nigroviridis/. Hox gene clusters containing multiple mapped genes are counted as a single point on each of the grids.

