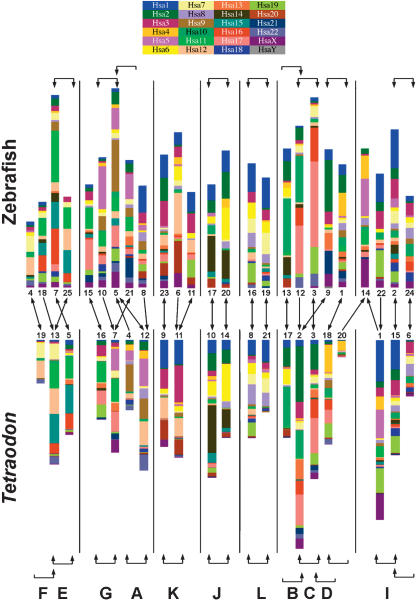
Figure 5.
Reconstruction of ancestral vertebrate proto-chromosomes by comparison of zebrafish and Tetraodon gene maps. The 25 zebrafish linkage groups are shown on top, and the 21 Tetraodon chromosomes are shown below. Genes are color-coded according to the positions of their human orthologs, and gene order within chromosomes of both species has been rearranged to highlight orthologous relationships with human genes. Brackets at the top and the bottom of the figure indicate relationships between paralogous chromosomes in each species. Brackets with two arrowheads indicate best reciprocal two-way matches between chromosomes according to the number of duplicate genes shared between these chromosomes (derived from Fig. 4). Brackets with one arrowhead indicate cases in which one chromosome overlapped significantly with a second chromosome, yet the most significant overlap for that second chromosome was with a third chromosome. In the zebrafish-zebrafish comparison, only those chromosomes exhibiting three or more shared duplicate gene pairs are bracketed. Arrows in the middle of the figure indicate the largest conserved syntenies between orthologous chromosomes in zebrafish and Tetraodon (derived from the data in Fig. 2B). Arrowheads are shown to reflect best two-way or one-way relationships as above. The letters at the bottom of the figure denote the ancestral chromosomes proposed by Jaillon et al. (2004); their ancestral group “H” did not emerge from our analysis.

