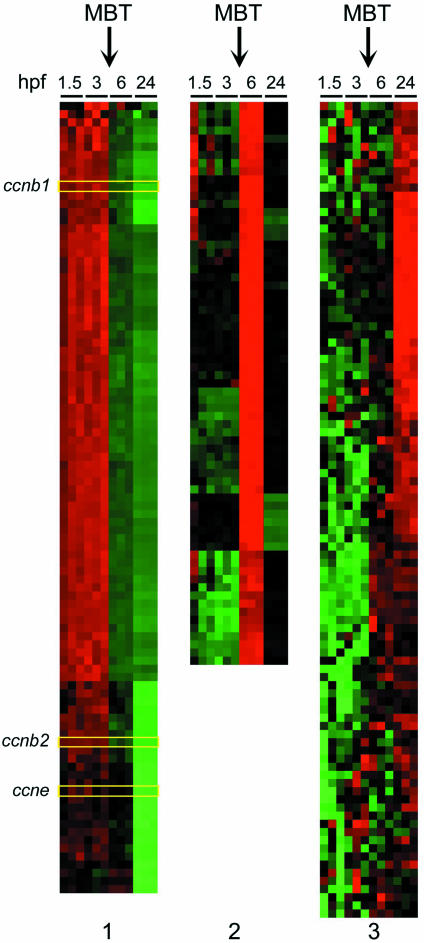
Figure 3.
Global gene expression profiles during zebrafish embryogenesis. All transcripts with >10-fold change in expression from 1.5–24 h post-fertilization (hpf) identified by zebrafish-specific microarray analysis are clustered according to similar time-dependent expression patterns with upregulated expression in red, downregulated genes in green and unchanged expression in black. Panel 1 shows those steady-state mRNAs that are markedly downregulated when embryonal transcription commences, including ccnb1, ccnb2 and ccne (highlighted). Panels 2 and 3 present those transcripts that are markedly upregulated after MBT at 6 and 24 hpf, respectively.

