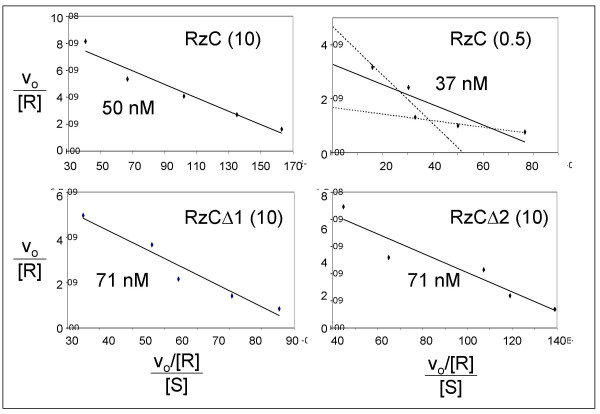
Figure 4.
Eadie-Hofstee plots for determining substrate binding affinities. Reaction velocity (vo) in micromoles•min-1 is normalized to total ribozyme concentration (1 nM). Indicated on each plot are the ribozyme species, the concentration of MgCl2 in millimolar (in parentheses) and the calculated Km value (negative of the slope). Gray trendlines for RzC at 0.5 mM MgCl2 subdivide the data set into regions of steep and shallow slopes with Km values of 90 nM and 12 nM.

