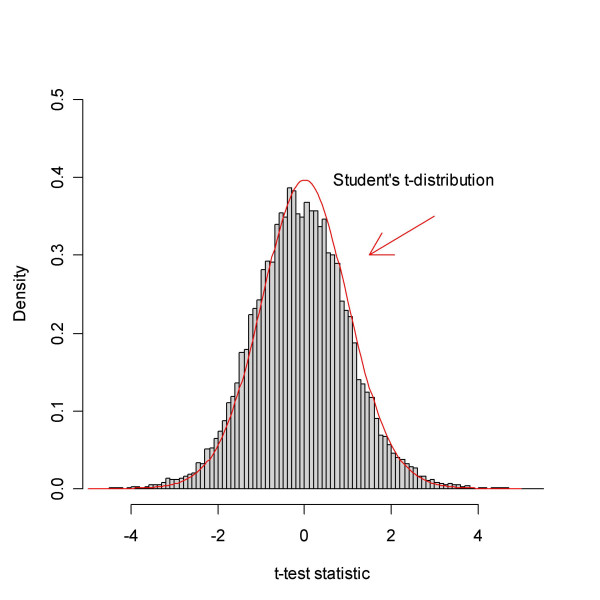
Figure 10.
Spira et al. data: Former smokers vs. Never smokers t-test statistic. The shape of the histogram indicates that there are more genes that are more highly expressed in Former smokers than the other way round, but on the whole there are rather few DEGs. Indeed, the estimates of p0 vindicate this and suggest that less than 10% of the genes are DEGs. Compare Figure 11.

