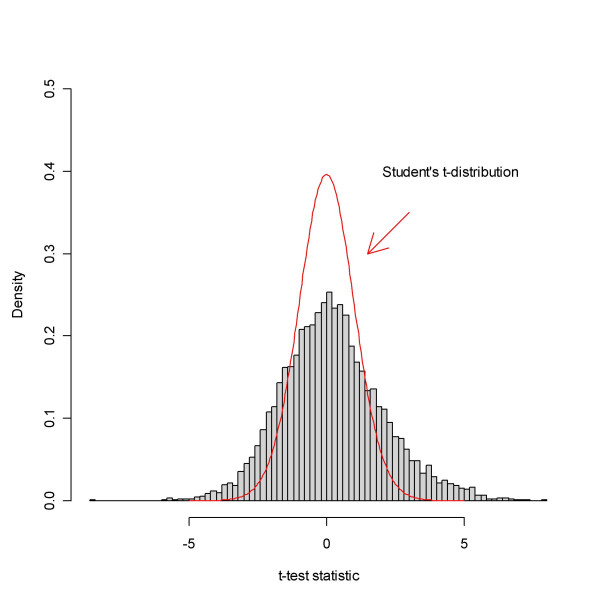
Figure 5.
The empirical distribution of the t-test statistic based on the data from Golub et al. The test compares the sample types AML and ALL. A comparison with the theoretical null distribution, Student's t-distribution, hints that there are too many extreme values to be accounted for by pure chance. In fact, evidence is that a substantial part of the genes differ.

