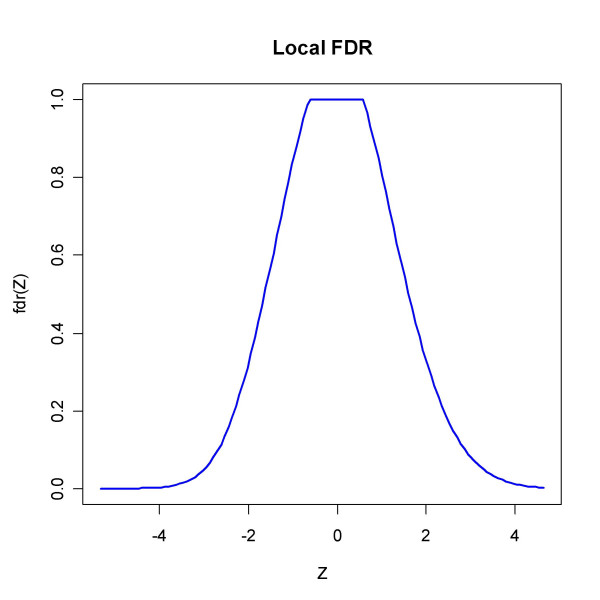
Figure 9.
The local fdr from locfdr applied to data from [32]. Using Z statistics based on the transformed test statistics (in R code Z = qnorm(pt(tt, df = 36)), pct0 = 0.5 and a standard normal density as null type), the function outputs the estimate p0 = 0.66 and a plot of the local fdr which reflects the skewness of the test statistic distribution. The requirement that LFDR be less than 0.2 would identify 1198 genes as significant.

