
Figure 3.
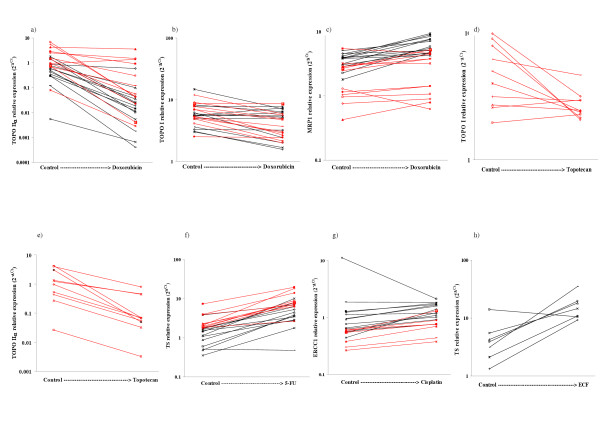
Changes in relative expression of putative chemoresistance genes in tumor-derived cells. Each dot represents the relative mRNA level for an individual sample, measured after in vitro drug exposure compared with untreated control cells. (a) TOPO IIα expression in breast (black lines) and ovarian (red lines) tumor cells after doxorubicin exposure. (b) TOPO I expression in breast (black lines) and ovarian (red lines) tumor cells after doxorubicin exposure. (c) MRP1 expression in breast (black lines) and ovarian (red lines) tumor cells after doxorubicin exposure. (d) TOPO I expression in ovarian tumor cells after topotecan exposure. (e) TOPO IIα expression in ovarian tumor cells after topotecan exposure. (f) TS expression in breast (red lines) and colorectal (black lines) tumor cells after 5-FU exposure. (g) ERCC1 expression in breast (black lines) and ovarian (red lines) tumor cells after cisplatin exposure. (h) TS expression in esophageal tumor cells after ECF exposure. The numerical data for these graphs is summarized in Tables 5-8.