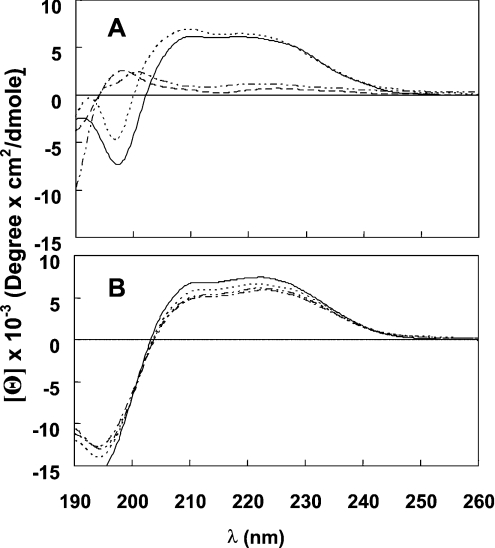
Figure 4. CD spectra of the peptides in solution and LPC.
(A) CD spectra of the lipopeptides in PBS. Spectra were measured at a peptide concentration of 100 μM. Peptide designations: [D]-L6k6-PA (———), [D]-L6k6-MA (·······), [D]-L6k6-DDA (----) and [D]-L6k6-DA (·–·–·–). (B) CD spectra of the lipopeptides in 1% LPC. Spectra were measured at a peptide concentration of 100 μM. Symbols are as in (A).

