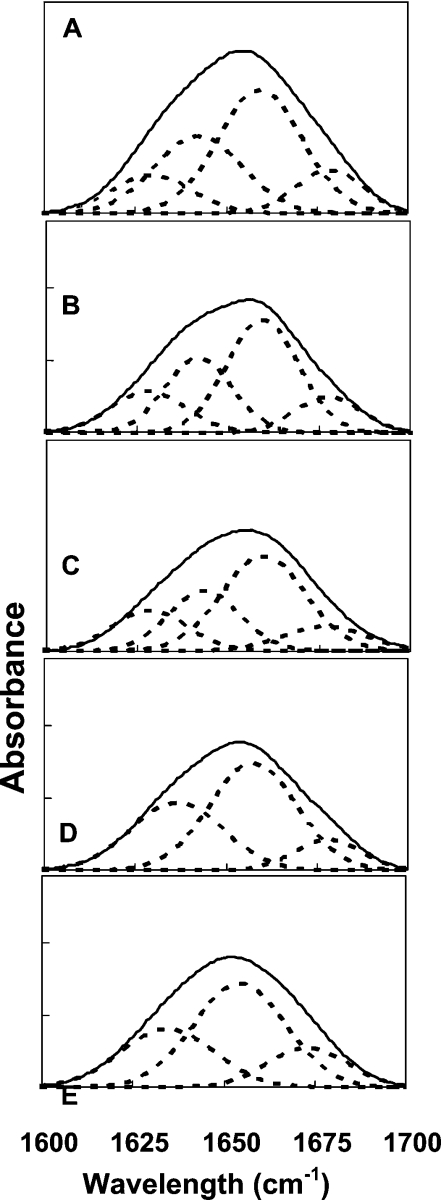
Figure 5. Deconvolution of the amide I spectra of the fully deuterated peptides incorporated into the PC/PE/PI/ergosterol (5:2.5:2.5:1, by weight) multibilayers as detected by FTIR spectroscopy.
The component peaks are the result of curve fitting using a Gaussian line shape. The sums of the fitted components superimpose on the experimental amide I region spectra. A molar ratio of approx. 1:30 was used. ———, deconvoluted amide I region spectra; -----, fitted structural components. (A) [D]-L6K6, (B) [D]-L6K6-DA, (C) [D]-L6K6-DDA, (D) [D]-L6K6-MA and (E) [D]-L6K6-PA.

