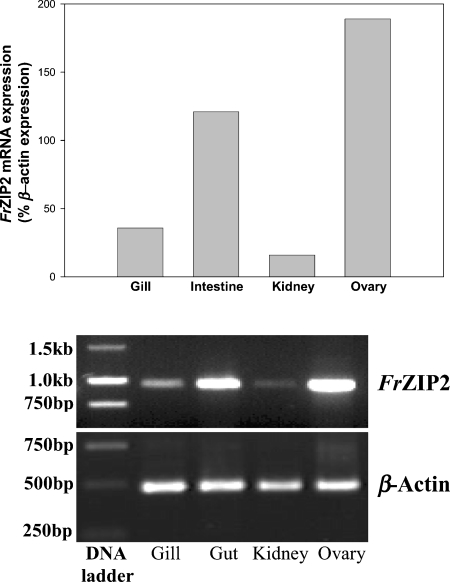
Figure 7. Distribution of FrZIP2 mRNA in various tissues of pufferfish by RT–PCR.
Upper panel: relative levels of FrZIP2 mRNA in pufferfish gill, intestine, kidney and ovary normalized by β-actin mRNA using SigmaGel software (Jandel Scientific). Lower panel: expression pattern of FrZIP2 and β-actin mRNA in agarose gels.

