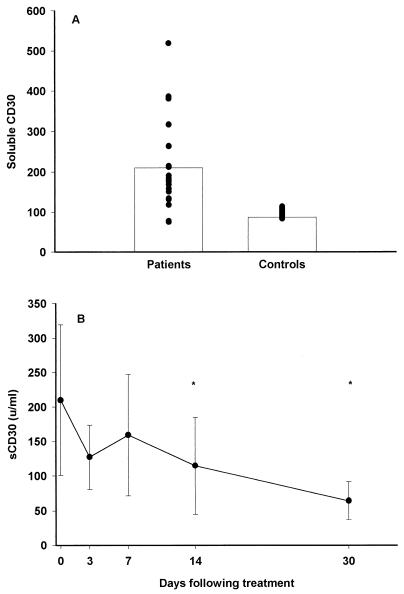
FIG. 1.
(A) Levels of sCD30 (means are indicated with bars) in 21 patients with acute malaria (before treatment) in comparison to those in 21 age-matched healthy controls; (B) mean levels of sCD30 in sera from 21 patients following treatment. Error bars indicate standard deviations. An ∗ indicates a significant difference from the value at day 0.

