

Abstract
Background
Many rural residents face barriers to eye care access. Government workforce data show a maldistribution of eye care providers in Western Australia however, no detailed information is available on regional coverage within the state. This study aimed to identify and map all eye care services in rural and remote Western Australia and to calculate the regional workforce rates.
Methods
A survey was sent to all optometry and ophthalmology practices in rural and remote Western Australia with questions on practitioner and equipment availability. Information on visiting services was captured directly through organisations as well as the survey. Geographic information systems were used to map service locations, calculate coverage of services relative to the population, and calculate full-time equivalent (FTE) per 100,000 of the population for each profession.
Results
A total of 58 optometry practices, 8 ophthalmology practices, 113 visiting optometry services and 43 visiting ophthalmology services in rural and remote Western Australia were identified and mapped. Most of the population (97.2%) lived within 100 km of an eye care service. Overall FTE per 100,000 for optometry and ophthalmology were 12.1 and 2.4, respectively. Regional FTE per 100,000 ranged from 2.1 to 19.5 for optometry and 0 to 4.2 for ophthalmology.
Conclusions
The results show broad coverage of visiting services but highlights regional discrepancies in optometry and ophthalmology workforce rates, with several regions failing to meet FTE recommendations.
Supplementary Information
The online version contains supplementary material available at 10.1186/s12913-025-12723-8.
Keywords: Ophthalmology, Optometry, Health workforce, Rural population, Geographic information systems
Background
Geographic accessibility in health care influences the utilisation of services, and a maldistribution of the workforce contributes to disparities in eye health between rural and metropolitan residents [1–3]. With the ageing population and rise in chronic disease prevalence, demands on the eye care workforce are predicted to increase globally [4]. Western Australia is the largest and least densely populated state in Australia. Around 2.1 million people live in the capital city of Perth, with the remaining 540,000 of the population distributed across more than 2 million square kilometres of land [5]. This creates a uniquely challenging environment for workforce coverage and service provision.
The eye care workforce predominantly includes optometrists and ophthalmologists who work autonomously and collaboratively to provide care at primary, secondary, and tertiary levels [6]. In rural Australia, optometry and ophthalmology practices tend to exist in larger towns, and eye care is provided by visiting services in more remote areas [7]. Visiting services are privately or publicly funded through State and Commonwealth initiatives, such as the Visiting Optometrists Scheme for optometry and the Rural Health Outreach fund and Medical Specialist Outreach Assistance Program for ophthalmology [8]. In Western Australia, Lions Outback Vision, based in the Kimberley, delivers many of the visiting optometry and public ophthalmology services across the state.
Historically in Western Australia, visiting ophthalmology services were infrequent and were restricted by a lack of equipment, and patients were often sent to Perth for further detailed examination [9, 10]. The Outback Vision Van is a mobile health unit introduced in 2016 that delivers visiting ophthalmology services [11]. An evaluation after the introduction of the Vision Van showed that it not only increased the number of outreach services, but seven of the 14 types of specialist equipment on the Van were previously unavailable in the areas that are visited [11]. The evaluation demonstrated that the Van reduced the need for patients to travel to the city to obtain care which resulted in cost savings for the health system [11].
Access to healthcare can be defined by availability, accessibility, accommodation, affordability, and acceptability [12]. Availability and accessibility are spatial factors that can be measured using area-based and distance-based means [13]. Geographic information systems (GIS) are frequently used tools to assess spatial accessibility and for strategic planning of health services at a population level [14–16]. Although GIS technology has been employed in the analysis of eye care services in countries such as New Zealand [17] and Canada [18], their use in Australia for eye health service distribution has been limited. Practitioner-to-population ratios also provide insight into the availability of services and are commonly used to measure workforce rates [6]. The Australian Institute of Health and Welfare (AIHW) workforce data for optometry and ophthalmology confirm the maldistribution of practitioners in Western Australia [19]. However, data are only available on overall rates in rural Western Australia and do not describe whether regional differences exist [19].
Therefore, the aim of this study was to identify and map the location of optometry and ophthalmology services in rural and remote Western Australia using GIS technology. The study aimed to calculate workforce rates in different regions across the state and identify potential gaps in services. An additional aim of this study was to use data captured directly from practices to enhance understanding of access to services from factors beyond spatial availability. The purpose of this research was to establish a basis for future detailed gap analysis, to assist policymakers in improving access to care, and for further simulation studies to predict service demands.
Methods
This study adhered to the tenets of the Declaration of Helsinki and ethics approval was granted by the University of Western Australia Human Research Ethics Committee (2024/ET000213).
Study sample
The Modified Monash Model (MMM) 2019 [20] rural classification system was chosen for this study as it measures remoteness and population size, and is the model that the Australian Government is transitioning towards for workforce programs [21]. MM 1 classification refers to metropolitan centres with increasing rurality as the number increases. Service locations were included in this study if they were located in MM 2 (regional centres), MM 3 (large rural towns), MM 4 (medium rural towns), MM 5 (small rural towns), MM 6 (remote communities), or MM 7 (very remote communities).
Practice locations
Ophthalmology and optometry practice addresses in Western Australia were identified using open access sources including the National Health Services Directory, Google Maps, and the Optometry Australia directory. All addresses were entered into the Australian Government Health Workforce Locator [22] to confirm they were located within MM 2 to MM 7.
Identified practices were contacted by telephone to check they were operational, and the clinic manager, optometrist, or ophthalmologist was invited to complete an online survey. Survey questions were designed to understand the distribution and availability of services, including the total full-time equivalent (FTE) at each practice and the availability of equipment at the practice. Ophthalmology hours included consulting and surgical time. Questions were modified for each profession; for example, optometry practices were asked about where patients were referred to for ophthalmology care, and ophthalmology practices were asked about subspecialty services.
An online survey was piloted with 12 participants to check the survey clarity and ease of use. Pilot participants shared a similar background to those in the implemented study but were based in a different geographic location. Questions were revised in response to feedback and pilot responses were not included in the final study. The final surveys were made available online using Qualtrics and included 23 questions for the optometry survey and 16 questions for the ophthalmology survey (Supplementary file 1). The survey link was emailed to practices that expressed interest over the phone, and a reminder email was sent after a few weeks. The survey was administered from May 2024 to August 2024. Responses were exported and collated in Microsoft Excel (version 2402). Follow up calls and online open-source information were used to complete data that were missing.
Visiting services
A combination of sources was used to discover the location of visiting services. Visiting services were defined in this study as outreach services where practitioners travel to deliver care to a location where permanent eye care services did not exist. A question in the survey asked whether practitioners delivered outreach services. If the response was affirmative, respondents were asked about the frequency and location of the services. Rural Health West, the state rural workforce agency, and Lions Outback Vision, an organisation that delivers outreach services, provided additional data on visiting services for both optometry and ophthalmology. Data on the type of outreach, frequency, and duration of service were collected from each source.
Population and boundary data
Population data from the most recent Australian Census in 2021 and geographical boundary shapefiles were obtained from the Australian Bureau of Statistics (ABS) website [5]. Greater Capital City Statistical Areas data from the ABS [23] were used to remove metropolitan areas of Western Australia from the map. Statistical Areas One (SA1) are the smallest unit of Census of Population and Housing data from the ABS [23] and were used to create high-acuity distance-based population analyses. It should be noted that the MMM 2019 classification system is based on the 2016 Census data and new SA1 areas were introduced in the 2021 Census. Therefore, some SA1 areas had no MMM classification. For FTE mapping of service-to-population ratios, SA3 population data were used. This was deemed more appropriate than SA1 as the geographic distribution of the population in remote Australia means that communities often have vast distances between them [21]. Using SA1 to visually display FTE mapping would have resulted in expansive areas where no services appeared available. Furthermore, SA3 boundaries share similarities with the regions defined by the Western Australia State Planning Commission [24] which may facilitate more meaningful comparisons in the context of service availability interpretation and alignment with policymakers.
Data analysis - mapping
All identified service location addresses were geocoded using Google Maps API into latitude and longitude coordinates [25]. Survey responses and visiting service information from organisations were cross-referenced to ensure that no duplication occurred. Where there was a discrepancy of hours reported between the eye care service provider and the funding organisation, the survey response from the provider was used. Quantum GIS (QGIS [version 3.34.3]) software was used to layer population and boundary data with practice coordinates to map services.
For distance-based analyses, SA1 centroids and Euclidean buffers of 50 km and 100 km were used. Euclidean distances are commonly used in the assessment of geographic availability of healthcare services and have strong correlation with network distances [26]. A distance of 100 km was chosen as this has been previously used in studies to measure healthcare access in rural and remote Western Australia [27] and 50 km was chosen to account for the different distances that patients are willing to travel depending on rurality [28]. Centroid position relative to buffers were extracted and analysed with population data in Excel. Using QGIS, population data were randomly distributed across each SA1 for the purpose of visually representing the relative population density but were not used in data analysis. The mapping of services used ABS data and survey responses on service location only, and survey responses regarding equipment and nearby services were not integrated into the GIS analysis.
Data analysis - survey
For this study, FTE per 100,000 was chosen as the metric to calculate service-to-population ratios as this facilitates comparison with AIHW workforce reports. Vector analysis tools were used to identify the SA3 that each service was located in. Then, the FTE per 100,000 of the population was calculated for each SA3, assuming 1 FTE to be 38 h for optometrists and 40 h for ophthalmologists in line with AIHW calculations [29]. For the six practices (9.1%) that did not respond and where no open access information was available, the average FTE from all other respondents was used. Other survey responses, including equipment, were collated and descriptively analysed in Microsoft Excel.
Results
A total of 58 optometry practices, 8 ophthalmology practices, 113 visiting optometry services and 43 visiting ophthalmology services were located and included in this study. Responses from 53 individual practices out of 66 identified practice locations were received, a response rate of 80.3% (Table 1). Of the 156 visiting services, 38 locations were discovered through the survey and the remainder were provided by Rural Health West and Lions Outback Vision.
Table 1.
Survey response rates of eye care services (MM 2-MM 7) and FTE per 100,000 per SA3 region in Western Australia
| SA3 Name | Established optometry and ophthalmology practices | Visiting services | Optometry | Ophthalmology | ||||||
|---|---|---|---|---|---|---|---|---|---|---|
| Practices identified (n) | Responded (n) | Response rate (%) | Services identified (n) | Established (FTE per 100,000) | Visiting (FTE per 100,000) | Total (FTE per 100,000) | Established (FTE per 100,000) | Visiting (FTE per 100,000) | Total (FTE per 100,000) | |
| Augusta -Margaret River - Busselton | 9 | 9 | 100 | 0 | 19.5 | 0.0 | 19.5 | 3.1 | 0.0 | 3.1 |
| Bunbury | 15 | 12 | 80 | 0 | 13.0 | 0.0 | 13.0 | 4.2 | 0.0 | 4.2 |
| Manjimup | 1 | 1 | 100 | 5 | 3.9 | 0.4 | 4.2 | 0.0 | 0.0 | 0.0 |
| Albany | 10 | 6 | 60 | 13 | 11.9 | 0.0 | 11.9 | 3.2 | 0.5 | 3.7 |
| Wheat Belt - North | 4 | 4 | 100 | 22 | 7.3 | 0.7 | 8.0 | 0.0 | 0.7 | 0.7 |
| Wheat Belt - South | 1 | 0 | 0 | 11 | 1.4 | 0.7 | 2.1 | 0.0 | 0.5 | 0.5 |
| Kimberley | 5 | 4 | 80 | 27 | 11.6 | 2.3 | 13.9 | 3.1 | 1.1 | 4.2 |
| East Pilbara | 4 | 4 | 100 | 12 | 12.2 | 1.0 | 13.1 | 0.0 | 0.9 | 0.9 |
| West Pilbara | 3 | 3 | 100 | 12 | 12.1 | 0.7 | 12.8 | 0.0 | 0.5 | 0.5 |
| Esperance | 2 | 1 | 50 | 7 | 13.2 | 0.2 | 13.4 | 0.0 | 1.4 | 1.4 |
| Gascoyne | 1 | 0 | 0 | 10 | 4.1 | 2.0 | 6.1 | 0.0 | 0.6 | 0.6 |
| Goldfields | 3 | 2 | 66.7 | 16 | 7.4 | 0.4 | 7.8 | 0.0 | 1.2 | 1.2 |
| Mid West | 8 | 7 | 87.5 | 21 | 15.1 | 0.8 | 15.8 | 2.3 | 0.1 | 2.4 |
| Total | 66 | 53 | 80.3 | 156 | 11.6 | 0.5 | 12.1 | 2.0 | 0.4 | 2.4 |
Eye care service locations
All established and visiting optometry and ophthalmology services were mapped (Fig. 1). Most established optometry services were private, except two services conducted from Aboriginal Medical Services in Geraldton and Bunbury, and one which was a Lions Outback Vision public hospital optometry service in Kununurra. There were eight established ophthalmology practices located, of which seven were private and one, Lions Outback Vision in Broome, was public. Visiting services were conducted in medical practices, Aboriginal Community Controlled Health Organisations, and hospitals. Of the 43 visiting ophthalmology services, 21 were delivered by the Lions Outback Vision Van which is denoted by a star symbol (Fig. 1D).
Fig. 1.

Map of eye care services in rural and remote Western Australia with SA1 regions (A-D) and a general reference map (E). A Optometry practices B Optometry visiting services C Ophthalmology practices D Ophthalmology visiting services E All eye care services
Proximity to services
Buffers around service locations showed the coverage of services across the state relative to population density (Fig. 2). Calculations of SA1 centroid position within 50 km and 100 km distances to an eye care service were tabulated alongside the MMM 2019 rural classification (Table 2). The majority (97.2%) of the population lived within 100 km of an established or visiting eye care service.
Fig. 2.
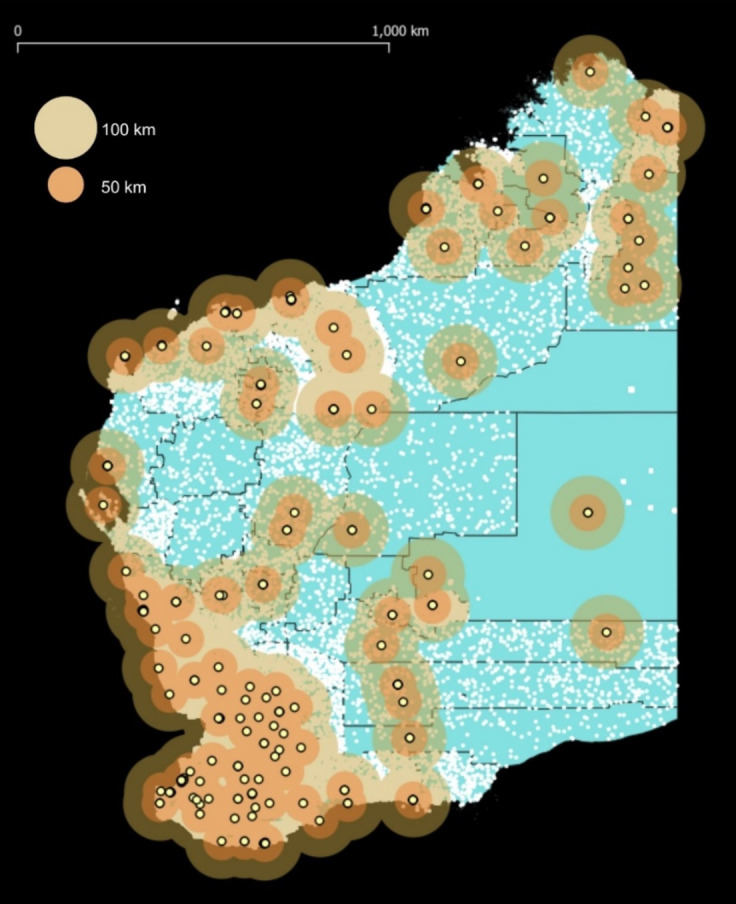
Eye care service locations in rural and remote Western Australia with 50 km and 100 km buffers on a SA1 map. White dots represent a simulated population to portray relative population density
Table 2.
Percentage of the population within 50 km and 100 km of an eye care service in rural and remote Western Australia by modified Monash model (MMM) 2019 rural classification and 2021 SA1 population data (n = 543,326)
| MMM 2019 Classification | Population (n) | Population within 50 km (n) | Population within 50 km (%) | Within 100 km (n) | Within 100 km (%) |
|---|---|---|---|---|---|
| 2 | 87,907 | 87,146 | 99.1 | 87,907 | 100 |
| 3 | 113,010 | 113,010 | 100 | 113,010 | 100 |
| 4 | 25,933 | 25,933 | 100 | 25,933 | 100 |
| 5 | 125,909 | 117,209 | 93.1 | 125,909 | 100 |
| 6 | 84,311 | 81,110 | 96.2 | 84,059 | 99.7 |
| 7 | 55,917 | 44,650 | 79.9 | 51,184 | 91.5 |
| Not classifieda | 50,339 | 39,869 | 79.2 | 40,099 | 79.7 |
| Total | 543,326 | 508,927 | 93.7 | 528,101 | 97.2 |
a2021 SA1 areas that do not have a MMM 2019 rural classification assigned
Service-to-population ratios
The practitioner FTE per 100,000 of the population illustrated the regional differences across rural and remote Western Australia (as shown in Table 1; Fig. 3). For optometry, the highest rate of combined established and visiting cover was the SA3 region of Augusta - Margaret River - Busselton at 19.5 FTE per 100,000 and the lowest was Wheat Belt - South at 2.1 FTE per 100,000. For ophthalmology, the highest was Bunbury and the Kimberley at 4.2 FTE per 100,000, and the lowest was Manjimup with no local services.
Fig. 3.

Map of eye care workforce FTE per 100,000 of the population, by SA3 regions in rural and remote Western Australia for optometry (left) and ophthalmology (right). Visiting services and eye care practice locations are indicated by yellow dots for optometry (left) and ophthalmology (right)
Survey responses revealed that some areas, such as Albany and the Mid West, had access to both public and private ophthalmology locally. However, in remote areas serviced by Lions Outback Vision such as West Pilbara, patients travelled to Perth for private ophthalmology. Conversely, in areas where there was private ophthalmology such as Busselton, patients had to travel to Perth for public ophthalmology.
Practice characteristics
Survey responses indicated that most optometry practices (84%) bulk-bill all or the majority of their patients for a standard eye examination. All ophthalmology practices privately bill all or the majority of patients for a standard consultation, except for Lions Outback Vision services which are funded by philanthropy and public funding. All ophthalmology practices offered general ophthalmology, cataract and glaucoma services, and most offered several subspecialties such as anterior eye, paediatrics, uveitis, vitreoretinal and oculoplastic.
A total of 45 optometry and six ophthalmology practices responded to questions on equipment availability (Table 3). The equipment listed in Table 3 were specifically asked in the survey (Supplementary file 1). 13 practices responded that they had ‘other’ equipment which included corneal topography, biometry, wavefront aberrometry, and scleral topography.
Table 3.
Equipment survey of eye care practices (excluding visiting services) in rural and remote Western Australia
| Equipment | Optometry (n = 45) | Ophthalmology (n = 6) | ||
|---|---|---|---|---|
| Practices with equipment (n) | Practices with equipment (%) | Practices with equipment (n) | Practices with equipment (%) | |
| Slit lamp | 45 | 100 | 6 | 100 |
| Tonometer | 45 | 100 | 6 | 100 |
| Retinal camera (standard and/or widefield) | 40 | 88.9 | 6 | 100 |
| Standard retinal camera | 22 | 48.9 | 4 | 80 |
| Ultrawide retinal camera | 22 | 48.9 | 3 | 50 |
| Visual field | 43 | 95.5 | 6 | 100 |
| Optical coherence tomography | 29 | 64.4 | 6 | 100 |
Discussion
It is recognised that the eye care workforce is maldistributed in Western Australia, however the regional workforce distribution across the state is not well understood. To address this gap, the goal of this study was to use GIS techniques to map and analyse service location and availability. The findings of this research show broad geographic coverage of eye care services. However, the results confirm the maldistribution of the workforce and show that there is variation in the availability of eye care services around rural and remote Western Australia. Service coordination between visiting ophthalmology and optometry services is important to reduce duplication of care and increase efficiency of services so that specialist care providers provide less primary care and can perform higher rates of surgery [30]. Although Fig. 1E shows overlap between optometry and ophthalmology services, the degree to which these are coordinated is unclear.
According to data reported by the AIHW in 2021, the average FTE rate for optometry in rural Western Australia was 12.5 [19], compared to 12.1 which was found in this study. It is conceptually difficult to determine eye care need and its relationship with workforce distribution. Although estimates can be made, needs are influenced by factors such as the demand for services, rate of chronic disease and the structure of the population [6]. In this study, the majority (97.2%) of the population lived within 100 km from an eye care service, however FTE rates suggested that services in many areas may not be frequent enough to meet the needs. Previous studies have suggested an optometrist-to-population ratio of 10 FTE per 100,000 in high-income countries [31]. A global study by the World Council of Optometry found only 46.2% of surveyed countries met this suggestion [32]. Although Australia was among the countries that met this recommendation [32], the results from this study show that five of 13 (38%) regions in rural Western Australia have a lower optometry workforce rate than recommended. This suggests a gap in service delivery in these regions.
AIHW reported an average FTE rate of 2.2 per 100,000 in rural Western Australia [19], compared to 2.4 in this study. The Royal Australian and New Zealand College of Ophthalmologists recommends a 1:25,000 ratio of ophthalmologists to meet population needs (4 FTE per 100,000) [33]. Results from this study suggest that only two of 13 (15%) regions, the Kimberley and Bunbury, met this criterion. While ophthalmology services in the Kimberley are public, ophthalmology services in Bunbury are private, so patients seeking public care are required to travel to Perth which is over 160 km away. This has potential implications for patients who are unable to afford private care. There is a recognised shortage of ophthalmologists in Australia [34–36] and initiatives such as the Regionally Enhanced Training Network established recently by the Royal Australian and New Zealand College of Ophthalmology have been developed to foster rural training and practice [37].
In Western Australia, Lions Outback Vision has used optometry-facilitated teleophthalmology as a strategy to increase access to ophthalmology care since 2011 [38]. A variety of ocular conditions can be managed [39] and direct surgical bookings for cataract surgery can be made using this model of telehealth [40]. Areas such as the West Pilbara have established optometry-facilitated telehealth models, so lower rates of ophthalmology FTE may still mean a high level of surgical and clinical support from ophthalmology provided to that area. Results of a recently published study showed that the level of collaborative care and telehealth varies significantly across Western Australia, suggesting potential opportunities to establish standardised frameworks and pathways [41].
The results of this study showed that most optometry practices had access to a range of diagnostic equipment. In the context of collaborative care with ophthalmology, equipment availability is a critical factor. For telehealth, a retinal camera or visual field is considered as advanced equipment, and optical coherence tomography (OCT) is considered state of the art equipment [42]. An equipment survey of 40 optometry practices in rural Western Australia conducted in 2017 showed that 80% of practices had a retinal camera and/or a visual field and 20% had OCT [43]. The three-fold increase in the proportion of practices with OCT found in this study suggests a trend towards optometrists increasingly incorporating advanced technology such as OCT into clinical practice [44, 45]. However, the quality of the service delivered or competence of the service providers cannot be inferred from the presence of equipment alone.
This study has limitations; firstly, data from multiple sources were collected, however there is the potential that self-funded visiting services may not have been captured in the data. Another limitation is that FTE values were only obtained for 90.9% of practices and values were estimated for the remaining practices. GIS analyses assume that patients attend practices closest to their home. Although this may be true, it is possible that rural patients might bypass their nearest service for reasons such as service satisfaction and outshopping [46]. Patients living in border towns might attend the closest service to them which may not be within their SA3 boundary. While it is acknowledged that Euclidean distances are more accurate in metropolitan areas [26] than in remote areas, they are still considered a useful and reasonable approach to measure spatial access in rural areas [47]. Further research could explore models that involve travel assumptions to measure travel impedance [47].
This study focused on optometry and ophthalmology services only. Future inquiries could include other eye care services such as school screenings, as well as personnel such as Aboriginal health workers and practitioners, registrars, optometry assistants, and orthoptists. This study sought to understand the location of services, but other dimensions of healthcare access such as approachability, acceptability, and appropriateness and the ability of patients to use services [48] were not fully explored. Future studies could investigate these factors to increase understanding of the care that is being delivered. Lastly, further research should explore the ways in which the rural workforce can be leveraged to facilitate improved access to eye care.
Conclusions
Rural residents face barriers to access eye care including local service availability. This research identified the locations and availability of established practices and visiting services in relation to the population in rural and remote Western Australia. This study provided insight into workforce rates and highlights several regions where rates are below recommended standards, suggesting gaps in service delivery. Further research is required to understand other facets of access to care and to identify opportunities for the eye health workforce to improve access to care. Ongoing support from key stakeholders and policymakers is important to develop and maintain adequate services that meet population needs.
Supplementary Information
Acknowledgements
Jingyi Chen is supported by an Australian Government Research Training Program Scholarship. We are grateful for the respondents to our survey and acknowledge the invaluable assistance with information kindly provided by Rural Health West and Lions Outback Vision.
This research received no specific grant from any funding agency in public, commercial, or not-for-profit sectors.
Abbreviations
- ABS
Australia Bureau of Statistics
- AIHW
Australian Institute of Health and Welfare
- FTE
Full-time equivalent
- GIS
Geographic information systems
- MMM
Modified Monash Model
- OCT
Optical coherence tomography
- SA
Statistical areas
Authors’ contributions
JC, KA, SB, AM, ST, and AT designed the study. JC collected the data, and JC, KA, MT, and AT contributed to data analysis and interpretation. JC drafted the manuscript. All authors critically reviewed the manuscript, contributed to writing, and approved the final manuscript.
Funding
No funding was received for this project.
Data availability
The datasets used and analysed during the current study are not shared publicly for privacy reasons. They may be available from the corresponding author if appropriate and on reasonable request.
Declarations
Ethics approval and consent to participate
The study was performed in accordance with the Helsinki declaration. Ethical approval was granted by the University of Western Australia Human Ethics Committee (2024/ET000213). All participants provided informed consent before participating in the study.
Consent for publication
Not applicable.
Competing interests
The authors declare no competing interests.
Footnotes
Publisher’s Note
Springer Nature remains neutral with regard to jurisdictional claims in published maps and institutional affiliations.
References
- 1.Thomas SL, Wakerman J, Humphreys JS. Ensuring equity of access to primary health care in rural and remote Australia - what core services should be locally available? Int J Equity Health. 2015;14(1):111. [DOI] [PMC free article] [PubMed] [Google Scholar]
- 2.Keeffe JE. Utilisation of eye care services by urban and rural Australians. Br J Ophthalmol. 2002;86(1):24–7. [DOI] [PMC free article] [PubMed] [Google Scholar]
- 3.Madden AC, Simmons D, McCarty CA, et al. Eye health in rural Australia. Clin Exp Ophthalmol. 2002;30(5):316–21. [DOI] [PubMed] [Google Scholar]
- 4.Burton MJ, Ramke J, Marques AP, et al. The Lancet global health commission on global eye health: vision beyond 2020. Lancet Glob Health. 2021;9(4):e489–551. [DOI] [PMC free article] [PubMed] [Google Scholar]
- 5.Australian Bureau of Statistics. Census datapacks. 2024. Available from: https://www.abs.gov.au/census/find-census-data/datapacks. [cited 2024 Aug 29].
- 6.World Health Organization. Eye care competency framework. Geneva; 2022. p. 80. Available from: https://www.who.int/publications/i/item/9789240048416.
- 7.National Rural Health Alliance. Eye and vision health in rural Australia. 2024. p. 4. Available from: https://www.ruralhealth.org.au/sites/default/files/publications/nrha-eye-and-vision-health-factsheet-final.pdf.
- 8.Australian Institute of Health and Welfare. Eye health measures for Aboriginal and Torres Strait Islander people 2023. 2023. p. 191. Available from: https://www.aihw.gov.au/reports/indigenous-australians/indigenous-eye-health-measures-2023/summary.
- 9.Kumar S, Tay-Kearney ML, Chaves F, et al. Remote ophthalmology services: cost comparison of telemedicine and alternative service delivery options. J Telemed Telecare. 2006;12(1):19–22. [DOI] [PubMed] [Google Scholar]
- 10.Kumar S, Yogesan K, Hudson B, et al. Emergency eye care in rural Australia: role of internet. Eye. 2006;20(12):1342–4. [DOI] [PubMed] [Google Scholar]
- 11.Fu S, Jeyaraj J, Turner AW. Evaluating the impact of the Lions Outback Vision mobile ophthalmology service. Clin Exp Ophthalmol. 2019;47(7):956–7. [DOI] [PubMed] [Google Scholar]
- 12.Penchansky R, Thomas JW. The concept of access: definition and relationship to consumer satisfaction. Med Care. 1981;19(2):127–40. [DOI] [PubMed] [Google Scholar]
- 13.Beks H, Wood SM, Clark RA, Vincent VL. Spatial methods for measuring access to health care. Eur J Cardiovasc Nurs. 2023;22(8):832–40. [DOI] [PubMed] [Google Scholar]
- 14.Fradelos EC, Papathanasiou IV, Mitsi D, et al. Health based geographic information systems and their applications. Acta Inform Med. 2014;22(6):402–5. [DOI] [PMC free article] [PubMed] [Google Scholar]
- 15.Higgs G. A literature review of the use of GIS-based measures of access to health care services. Health Serv Outcomes Res Methodol. 2004;5(2):119–39. [Google Scholar]
- 16.Wang F. Why public health needs GIS: a methodological overview. Ann GIS. 2020;26(1):1–12. [DOI] [PMC free article] [PubMed] [Google Scholar]
- 17.Ramke J, Zhao J, Wilson O, et al. Geographic access to eye health services in Aotearoa New Zealand: Which communities are being left behind? Clin Exp Optom. 2023;106(2):158–64. [DOI] [PubMed] [Google Scholar]
- 18.Shah T, Milosavljevic S, Bath B. Geographic availability to optometry services across Canada: mapping distribution, need and self-reported use. BMC Health Serv Res. 2020;20(1):639. [DOI] [PMC free article] [PubMed] [Google Scholar]
- 19.Australian Institute of Health and Welfare. Eye health measures for Aboriginal and Torres Strait Islander people 2023: interactive data. Workforce and outreach services. 2023. Available from: https://www.aihw.gov.au/reports/indigenous-australians/eye-health-measures-indigenous-2023/contents/workforce-and-outreach-services. [cited 2024 Aug 29].
- 20.Australian Government Department of Health and Aged Care. Modified Monash Model. 2023. Available from: https://www.health.gov.au/topics/rural-health-workforce/classifications/mmm#about-the-modified-monash-model. [cited 2024 Aug 29].
- 21.Versace VL, Skinner TC, Bourke L, et al. National analysis of the Modified Monash Model, population distribution and a socio-economic index to inform rural health workforce planning. Aust J Rural Health. 2021;29(5):801–10. [DOI] [PubMed] [Google Scholar]
- 22.Australian Government Department of Health and Aged Care. Health workforce locator. 2024. Available from: https://www.health.gov.au/resources/apps-and-tools/health-workforce-locator. [cited 2024 Aug 29].
- 23.Australian Bureau of Statistics. Main structure and greater capital city statistical areas. 2021. Available from: [cited 2024 Aug 29]. https://www.abs.gov.au/statistics/standards/australian-statistical-geography-standard-asgs-edition-3/jul2021-jun2026/main-structure-and-greater-capital-city-statistical-areas
- 24.Western Australian Planning Commission. State planning strategy 2050. WAPC; 2014. Available from: https://www.wa.gov.au/government/publications/state-planning-strategy-2050. [cited 2025 Mar 14].
- 25.Google Maps Platform. Geocoding API overview. 2024. Available from: https://developers.google.com/maps/documentation/geocoding/overview. [cited 2024 Aug 29].
- 26.Apparicio P, Abdelmajid M, Riva M, Shearmur R. Comparing alternative approaches to measuring the geographical accessibility of urban health services: distance types and aggregation-error issues. Int J Health Geogr. 2008;7:7. [DOI] [PMC free article] [PubMed] [Google Scholar]
- 27.Dudko Y, Kruger E, Tennant M. Geographic distribution of point-in-time access to subsidised dental services in Western Australia. Aust J Prim Health. 2016;22(6):569–75. [DOI] [PubMed] [Google Scholar]
- 28.McGrail MR, Humphreys JS, Ward B. Accessing doctors at times of need–measuring the distance tolerance of rural residents for health-related travel. BMC Health Serv Res. 2015;15(1). [DOI] [PMC free article] [PubMed]
- 29.Australian Institute of Health and Welfare. Health workforce. 2024. Available from: https://www.aihw.gov.au/reports/workforce/health-workforce. [cited 2024 Aug 29].
- 30.Turner AW, Mulholland WJ, Taylor HR. Coordination of outreach eye services in remote Australia. Clin Exp Ophthalmol. 2011;39(4):344–9. [DOI] [PubMed] [Google Scholar]
- 31.Holden B, Resnikoff S. The role of optometry in vision 2020. J Community Eye Health. 2002;15:33–6. [PMC free article] [PubMed] [Google Scholar]
- 32.Gammoh Y, Morjaria P, Block S, et al. Global survey of optometry: defining variations of practice, regulation and human resources between countries. Clin Optom (Auckl). 2023;16:211–20. [DOI] [PMC free article] [PubMed] [Google Scholar]
- 33.The Royal Australian and New Zealand College of Ophthalmologists. RANZCO’s vision for Australia’s eye healthcare to 2030 and beyond. Surry Hills: NSW; 2023. p. 115. Available from: https://ranzco.edu/wp-content/uploads/2023/06/RANZCO-Vision-2030-and-beyond-v2.pdf.
- 34.Department of Health. Australia’s future health workforce– ophthalmology. Canberra; 2018. p. 48.
- 35.Allen P, Jessup B, Khanal S, et al. Distribution and location stability of the Australian ophthalmology workforce: 2014–2019. Int J Environ Res Public Health. 2021;18(23). [DOI] [PMC free article] [PubMed]
- 36.Obamiro K, Jessup B, Allen P, et al. Considerations for training and workforce development to enhance rural and remote ophthalmology practise in Australia: a scoping review. Int J Environ Res Public Health. 2022;19(14). [DOI] [PMC free article] [PubMed]
- 37.The Royal Australian and New Zealand College of Ophthalmologists. 2023 Vocational training program information for the RANZCO regionally enhanced training network. 2023. Available from: https://ranzco.edu/wp-content/uploads/2023/01/RETN_Information_for_Application_background_info_012023.pdf. [cited 2024 6 Sep].
- 38.Johnson KA, Meyer J, Yazar S, Turner AW. Real-time teleophthalmology in rural Western Australia. Aust J Rural Health. 2015;23(3):142–9. [DOI] [PubMed] [Google Scholar]
- 39.Kiburg KV, Turner A, He M. Telemedicine and delivery of ophthalmic care in rural and remote communities: drawing from Australian experience. Clin Exp Ophthalmol. 2022;50(7):793–800. [DOI] [PMC free article] [PubMed] [Google Scholar]
- 40.McGlacken-Byrne A, Turner AW, Drinkwater J. Review of cataract surgery in rural north Western Australia with the Lions Outback Vision. Clin Exp Ophthalmol. 2019;47(6):802–3. [DOI] [PubMed] [Google Scholar]
- 41.Chen J, Bentley SA, McKendrick AM, et al. Rural eye care access, workforce challenges and opportunities: perspectives of the eye health workforce in western Australia. Austr J Rural Health. 2025;33(1). [DOI] [PMC free article] [PubMed]
- 42.Turner A, Razavi H, Copeland SP. Increasing the impact of telehealth for eye care in rural and remote Western Australia. 2014. p. 22. Available from: https://www.outbackvision.com.au/wp-content/uploads/2024/03/increasing-the-impact-of-telehealth-for-eye-care-in-rural-and-remote-western-australia.pdf.
- 43.Razavi H, Copeland SP, Turner AW. Increasing the impact of teleophthalmology in Australia: analysis of structural and economic drivers in a state service. Aust J Rural Health. 2017;25(1):45–52. [DOI] [PubMed] [Google Scholar]
- 44.Tang V, Symons RCA, Guest D, McKendrick AM. An overview of optometrists’ diabetic retinopathy practice patterns - a cross-sectional survey. Ophthalmic Physiol Opt. 2021;41(4):885–95. [DOI] [PubMed] [Google Scholar]
- 45.Conway MP, Forristal MT, Treacy MP, Duignan ES. Investigating the role of optometrists in teleophthalmology and the implications of increasing access to advanced imaging techniques and digital referral: a systematic search and review. Telemed J E Health. 2021;27(9):974–81. [DOI] [PubMed] [Google Scholar]
- 46.Sanders SR, Erickson LD, Call VR, et al. Rural health care bypass behavior: how community and spatial characteristics affect primary health care selection. J Rural Health. 2015;31(2):146–56. [DOI] [PubMed] [Google Scholar]
- 47.Nesbitt RC, Gabrysch S, Laub A, et al. Methods to measure potential spatial access to delivery care in low- and middle-income countries: a case study in rural Ghana. Int J Health Geogr. 2014;13(1):25. [DOI] [PMC free article] [PubMed] [Google Scholar]
- 48.Levesque JF, Harris MF, Russell G. Patient-centred access to health care: conceptualising access at the interface of health systems and populations. Int J Equity Health. 2013;12(1):18. [DOI] [PMC free article] [PubMed] [Google Scholar]
Associated Data
This section collects any data citations, data availability statements, or supplementary materials included in this article.
Supplementary Materials
Data Availability Statement
The datasets used and analysed during the current study are not shared publicly for privacy reasons. They may be available from the corresponding author if appropriate and on reasonable request.