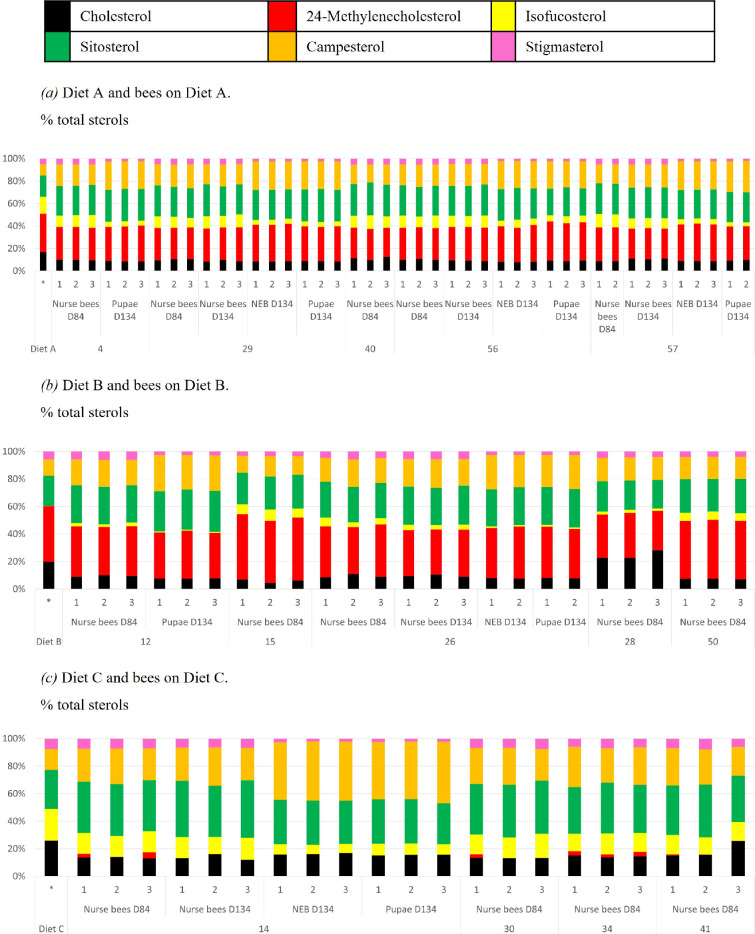
Figure 2.
The sterol profiles of the Diets (leftmost bars) and honeybees (next multiple bars) (Experiment 1). Sterol analyses were performed on samples collected on D84 (nurse bees) or D134 (nurse bees, pupae and bees newly emerged from capped brood (NEB), without access to food). 1, 2, 3 are replicates of 5−8 bees each; the numbers at the bottom are the colony codes in the tent experiment. Full data are available in electronic supplementary material, figure S6 and table S11.

