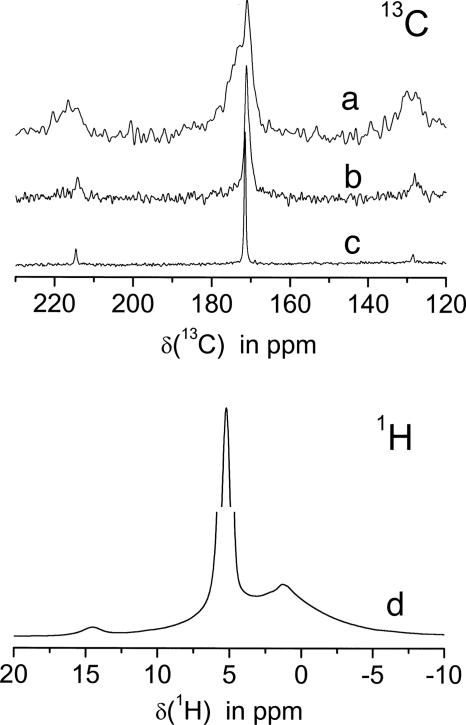
Fig. 3.
NMR spectra of nacre. (Upper)13C NMR spectra of the carboxyl region also displaying the spinning sidebands. Trace a, CP MAS spectrum of the protein (CP time: 1 ms); trace b, CP MAS spectrum of the amorphous carbonate (CP time: 8 ms) in comparison with the single pulse experiment; trace c, showing the aragonite resonance of the crystals. (Lower) Trace d shows the 1H spectrum at 12.5 kHz. Note the interception of the y axis between 25% and 75% of the water signal at 5.8 ppm to display the weak line at 14.4 ppm.

