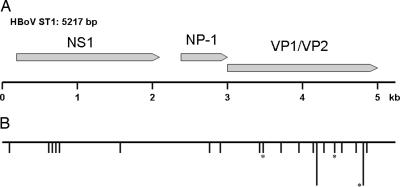
Fig. 2.
Map of the HBoV genome. (A) Schematic map of isolate ST1 of HBoV showing the three ORFs as arrows: NS1, 1,920 nt (nucleotides 183-2102), 639 aa; NP-1, 660 nt (nucleotides 2340-2999), 219 aa; and VP1/VP2, 2,016 nt (nucleotides 2986-5001), 671 aa. (B) A map showing the location of the 26 nucleotide differences that were detected between two isolates of HBoV. The horizontal line represents the sequence of ST1, and each vertical line represents a nucleotide difference to ST2. In two cases where several differences were located close together, a longer vertical line representing four differences was used. The asterisks mark the three differences that resulted in a predicted amino acid change.

