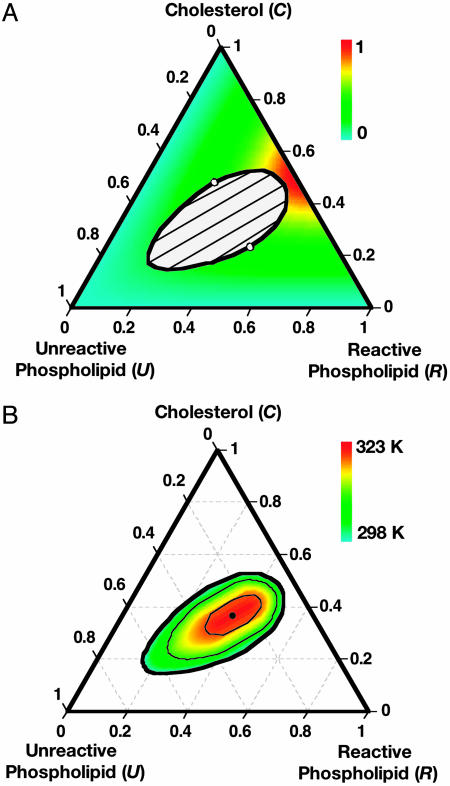
Fig. 2.
Calculated ternary phase diagrams at various temperatures with tie lines and complex concentrations. Parameters used are the same as in Fig. 1. (A) Isothermal phase diagram at 298 K (same as Fig. 1 A). Tie lines are shown in the two-phase region. Outside the two-phase region, the mole-fraction concentration of complex is shown according to the indicated color code. (B) Ternary phase diagram as a function of temperature (see color code bar). The isothermal binodal curves are at 298, 308, and 318 K, and the ternary critical point is at 323 K. The minimum separation of the 298 K binodal curve and the R–C axis is ≈5 mol %.

