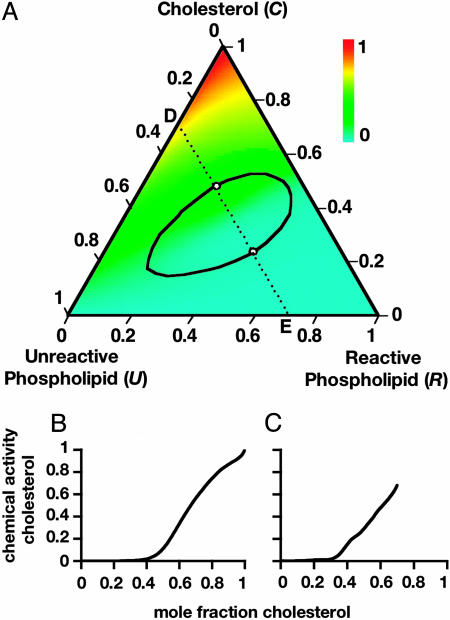
Fig. 3.
Calculated chemical activity of cholesterol at 298 K for the same parameters as in Fig. 1. (A) Color-coded chemical activity. Note that other two-phase or three-phase regions will appear in this diagram if at some point the activity of cholesterol is equal to the activity of cholesterol solid or solid solution. The same holds for the activity of the phospholipid R and its solid or solid solution. (B and C) Plots of chemical activity of cholesterol along directions R–C (B) and E–D (C). The chemical activity increases most rapidly around the 1:1 stoichiometric composition, in both the one-phase and the two-phase regions.

