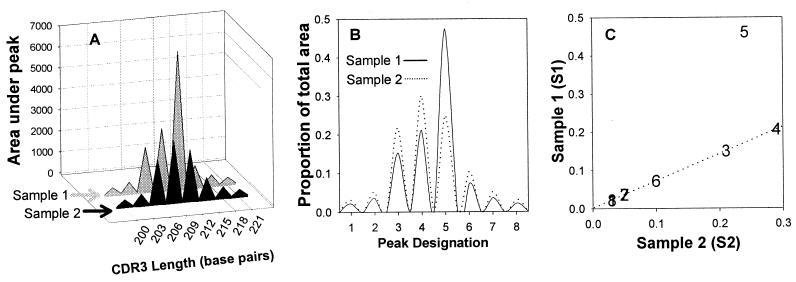
FIG. 1.
The MaGiK method of TCR repertoire comparison. CDR3 lengths for a TCRVβ family between hypothetical samples 1 and 2 (S1 and S2, respectively) are compared. S1 represents a TCRβ family with a clonal expansion. S2 represents an idealized TCRβ family with CDR3 length magnitudes averaged from several controls with no expansions. (A) The area (ai) under each peak (i) was calculated. (B) Each peak's proportional representation (pi = ai/Σai) was computed. For each peak, a sample proportion ratio [PRi = S1(pi)/S2(pi)] was computed. The median of the ratios (Rm) from all peaks in a family was then calculated. S1 proportions were then multiplied by the median PR [aS1(pi) = S1(pi) × medianPR] to standardize their distributions. (C) Expansions were identified among the S1 peaks whose adjusted proportions aS1(pi) were greater than 3 standard deviations above the corresponding S2 peak's proportion.

