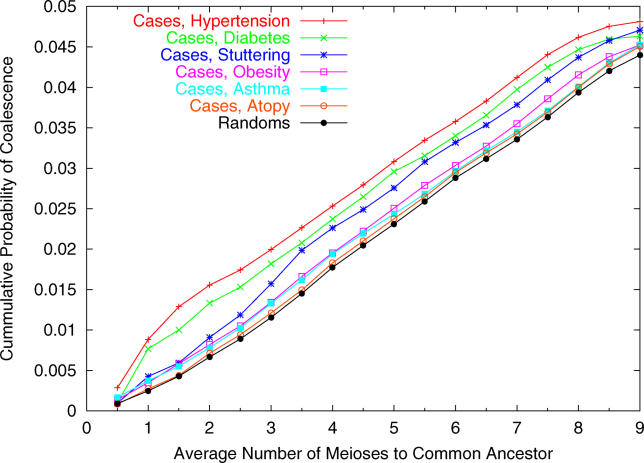
Figure 2. Cumulative Probability of Coalescence within the Last n Meioses in the Hutterite Founder Population.
Each line plots the estimated probability that two chromosomes drawn at random, from different individuals affected with a given phenotype, or from two random control individuals, descend from a single ancestral chromosome within the last n meioses. These estimates are based on the recorded Hutterite genealogy. The x-axis plots the average number of meioses along the two lineages back to the common ancestor. Notice that in the most recent generations, the case samples coalesce at higher rates than do random controls.

