
Figure 5.
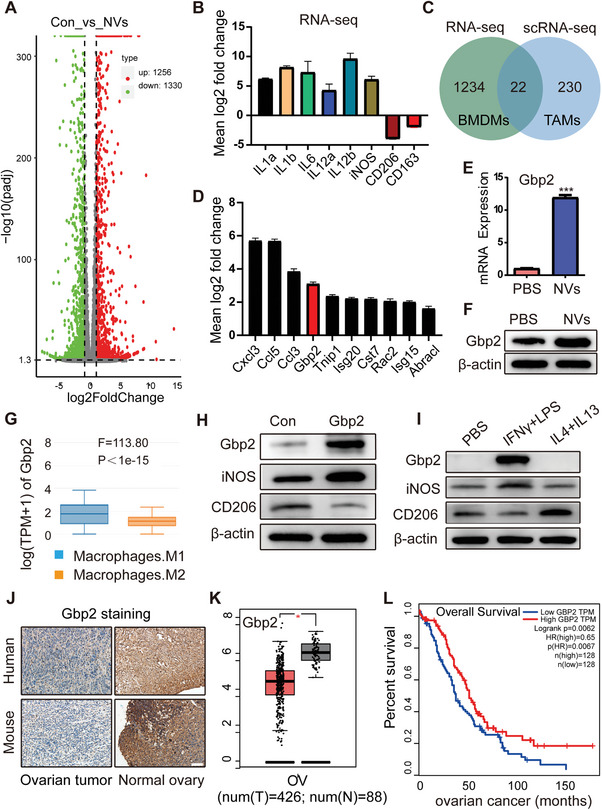
The role of nanovaccine‐induced Gbp2 in tumor prognosis. A) Number of differentially expressed genes identified in the RNA‐seq analysis. B) RNA‐seq results showing the expression levels of IL1a, IL1b, IL6, IL12a, IL12b, CD206, and CD163 in BMDMs treated with nanovaccines for 12 h. C,D) Enrichment of differentially expressed genes identified in both RNA‐seq and scRNA‐seq datasets. E,F) Detection of Gbp2 expression following BMDM activation with nanovaccines, measured by RT‐PCR and western blot. G) Expression levels of Gbp2 in M1 and M2 macrophages, obtained from the GEPIA database. H,I) Immunoblot (IB) analysis of the indicated proteins derived from RAW264.7 macrophages stably overexpressing Gbp2 (H) and those induced by (LPS + IFN‐γ) and (IL4 + IL13) (I). J) Immunohistochemical staining of Gbp2 in normal and neoplastic ovarian tissues from human and mouse samples, scale bar: 100 µm. K) Expression of Gbp2 in human ovarian cancer samples from the TCGA database. L) Prognosis of Gbp2 in ovarian cancer patients from TCGA database. Data are presented as mean ± SD, analyzed using an unpaired two‐sided Student's t test (*p < 0.05, ***p < 0.001).