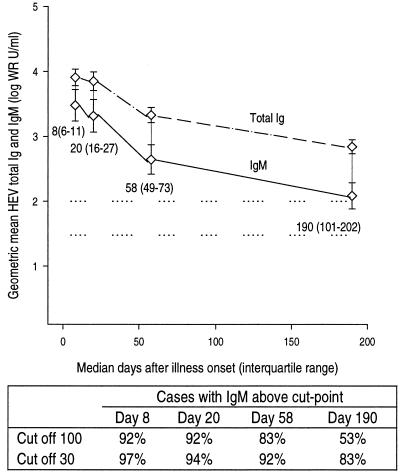
FIG. 2.
Levels of HEV IgM (solid line) and total Ig (dashed line) among 36 patients with hepatitis E proven by detection of HEV viremia. Each patient had four consecutive serum specimens collected. Data are grouped by median day of specimen collection; these values plus the associated interquartile ranges in parentheses are given below the plot of HEV IgM. Error bars represent the 95% confidence interval for the geometric mean. Horizontal dotted reference lines are drawn at 30 and 100 WR units/ml. The table below the line plot gives the proportions of patients with HEV IgM detected at four median time points for assay cut points of 100 and 30 WR units/ml.

