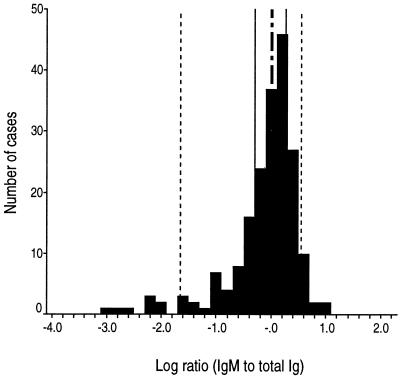
FIG. 5.
Histogram of HEV IgM-to-total-Ig ratios for the true-positive specimen set (n = 197). The interval scale is logarithmic; the mode is 1.6. Vertical reference lines mark cumulative distribution percentiles, as follows: dotted lines, 5 and 95%; solid lines, 25 and 75%; dashed-and-dotted line, 50%. Cases to the right of the 5% reference line (n = 189) appear to represent primary infections, whereas cases to the left of the 5% reference line (n = 8) appear to represent secondary infections with anamnestic antibody responses.

