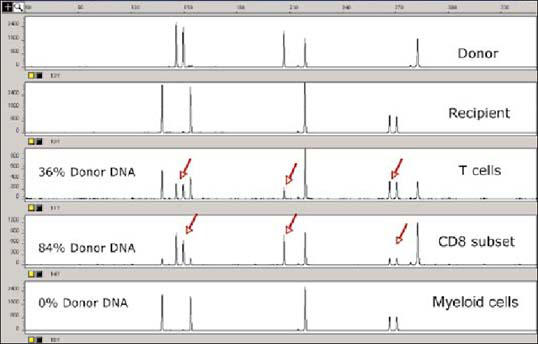
Figure 4.

Evaluation of chimerism status by STR analysis after liver transplantation of a patient with severe graft-versus-host disease. Row 1 shows the STR profile of the donor and row 2, the recipient. After transplantation, the recipient's T-cell profile showed 36% donor DNA (row 3), while the CDS subset profile showed 84% donor DNA (row 4). The myeloid cells, however, were not of donor origin and showed no donor DNA (row 5).
