
Figure 4.
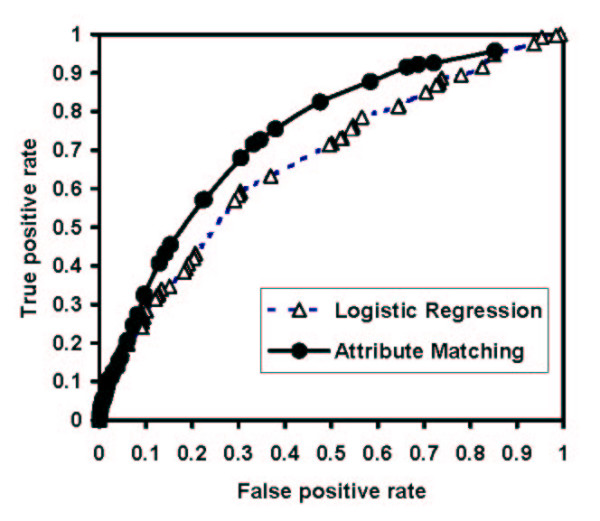
Receiver operating characteristic curves for two methods of pretest probability assessment. The area under the curve measurements were 0.74 (95% CI 0.65 to 0.82) for the attribute matching curve and 0.68 (95% CI 0.62 to 0.77) for the logistic regression method.