
Figure 5.
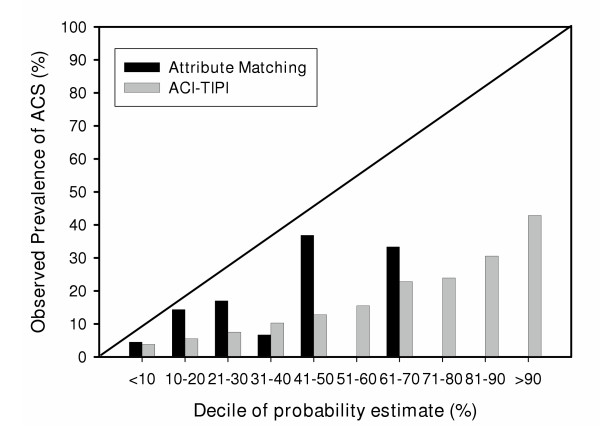
Plot of the actual prevalance of acute coronary syndrome as a function of the predicted probability of acute coronary syndrome in 7,059 patients without ST segment elevation. Data are aggregated within deciles. The diagonal line represents the ideal relationship between predicted probability versus observed probability.