
Figure 6.
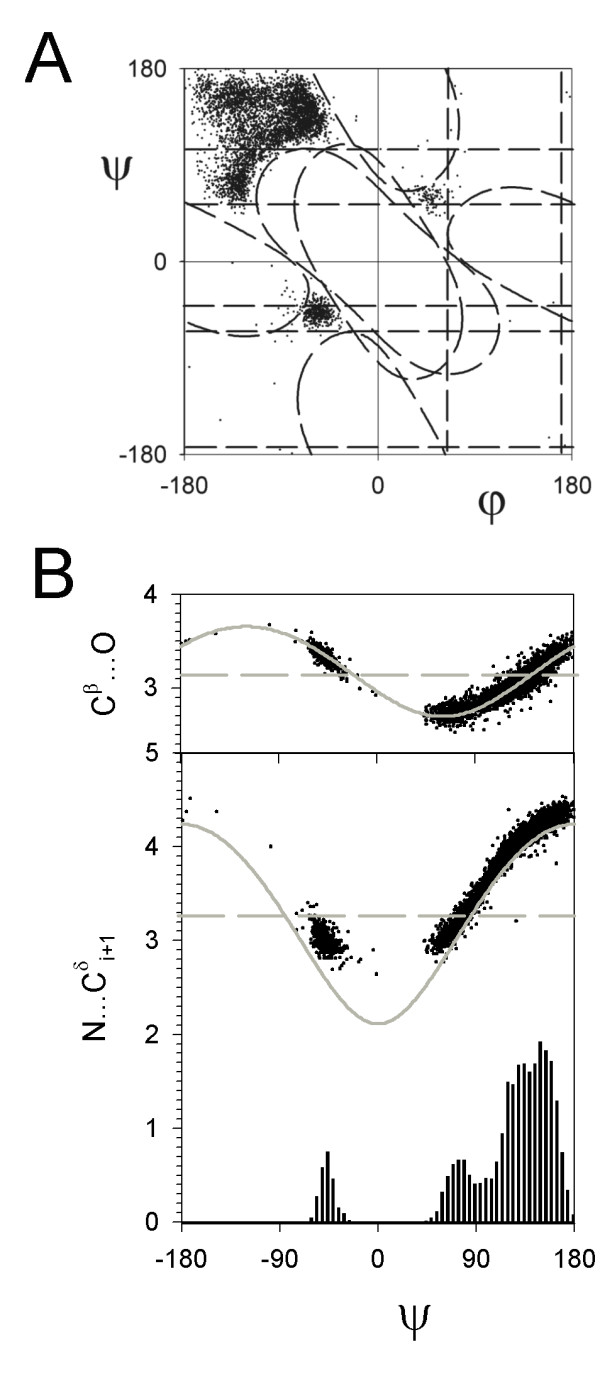
Pre-proline parameters. (A) The Ramachandran plot. The dashed lines show the steric clashes that define some of the boundaries of the observed densities (see Figure 2C). (B) The distributions of various inter-atomic interactions as a function of ψ. The dashed lines show the limit of the VDW diameters. The solid grey line gives the model curve calculated with ideal geometry. At the bottom is the frequency distribution of the ψ angle.