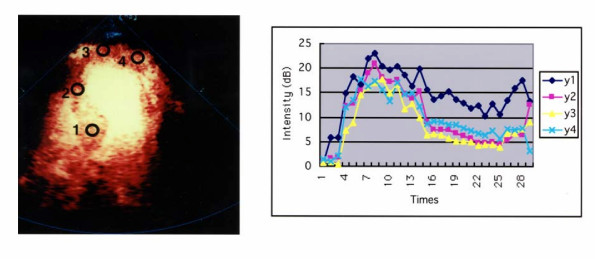
Figure 1.
Quantitative analysis of harmonic power Doppler imaging. A. Four different regions of interest are drawn on the digital clip. The ROI can be individually repositioned in each frame to match the anatomy. B. The graph shows time-intensity curves of the mean Doppler information (dB) from the ROIs. y1 = basal septum, y2 = mid septum, y3 = apex, y4 = apical portion of lateral segment.

