
Figure 1.
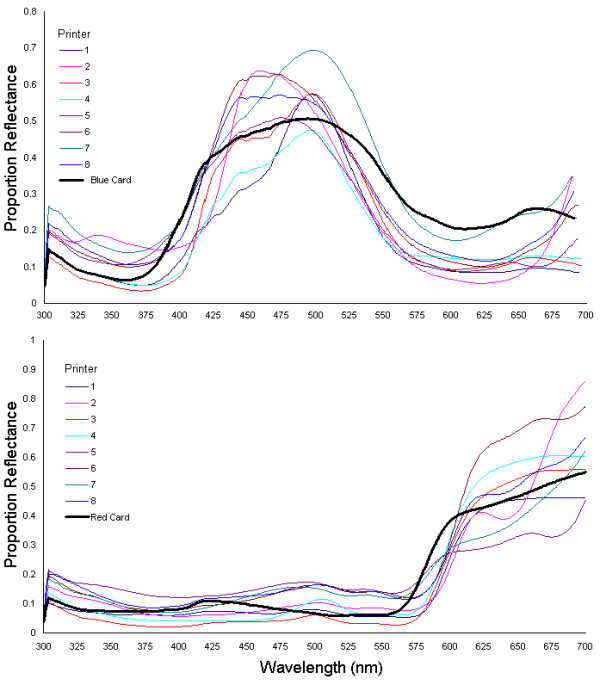
Spectrophotometry Results Showing the Variation that Exists Between the Different Printers. Two plots of the average reflectance spectra from the 8 different printer types, for the blue-green colour blocks with B & G values of 200 and R value of 0 (top chart), and the red colour blocks with an R value of 175 and B & G values of 0 (bottom chart). This shows the amount of variation that exists between the different printers, in producing what should have been colour blocks with the same spectra. The spectra of the coloured paint cards used in the matching experiments are included for reference.