
Figure 2.
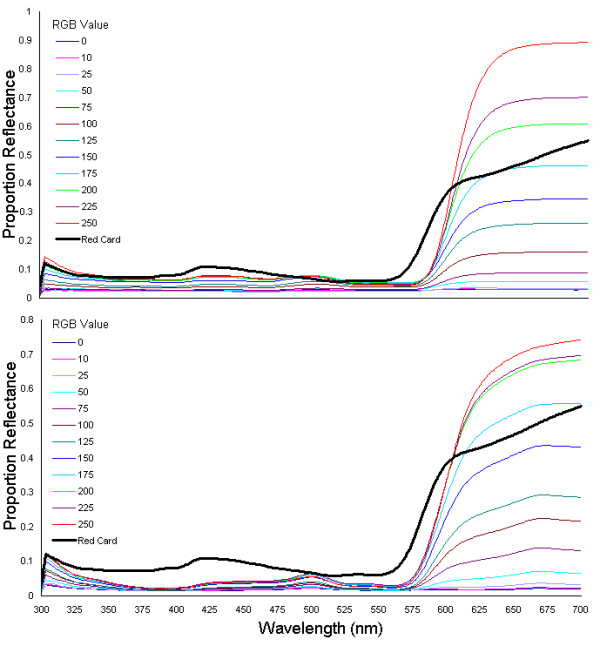
Spectrophotometry Results Showing the Uneven Scaling of Spectra with Equally Spaced RGB Values. The two plots show the average reflectance spectra for all the colour blocks included in the study on the red charts, for two of the printers used in the experiments. The top chart shows a 'good' printer, which produced a printed chart with approximately even spacing between the blocks with increasing R-values. This contrasts strongly with the bottom chart, produced from a different printer, which shows an uneven spacing between the spectra, and a 'bunching' of spectra at low and high R-values, meaning that the even spaces in RGB space did not correspond to an even spacing in spectral intensity.