
Figure 6.
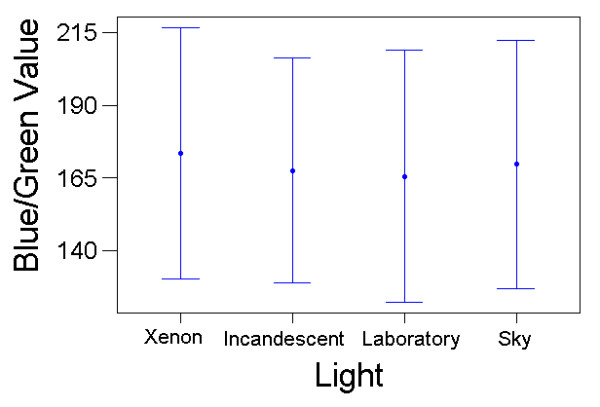
Colour Matching Results with the Blue-Green Charts Under Different Light Conditions. Variation in colour matching choices that subjects made (mean blue/green value on RGB scale, with standard deviation bars) under the Xenon, incandescent, laboratory and skylight light conditions. Results from all colour matches made, averaged across printers and subjects.