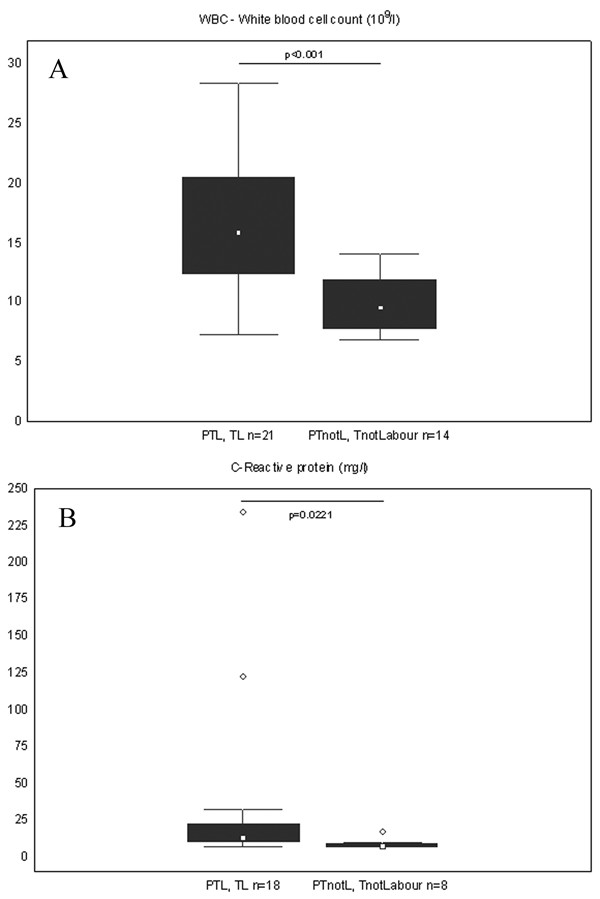
Figure 4.

WBC and CRP levels in labour compared to not in labour group. Box and whisker plots represent (A) white blood cell count (109/l) (B) C-reactive protein (mg/l) in the blood of women in the study groups. The two groups are: In labour (including preterm labour (PTL) and term labour (TL) and not in labour (including preterm not in labour (PTnotL) and term not in labour (TnotLabour). The number of patients analysed in each group is marked in each bar in the bar chart. The box represents median value with 25%–75% of all data falling within the box. The whiskers extend to the non-outlier range. Outliers are marked as circles. Significant differences between the groups are shown above the box plots.
