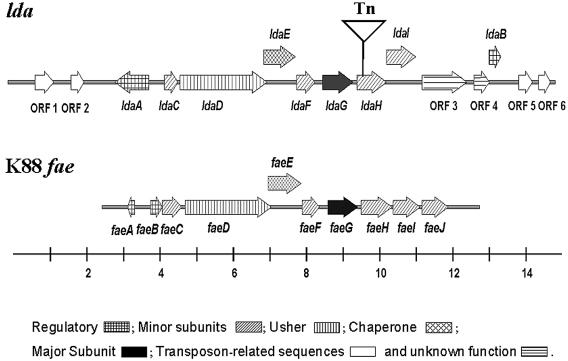
FIG. 3.
Maps of lda and K88 fae loci (drawn to scale). The locations and directions of genes are indicated by arrows, and the point of Tn5 insertion in pV-B-6-Tn is shown by an inverted triangle. A line scale drawn below indicates the size in kb. The shading patterns within the arrows indicate the predicted functions of the proteins as indicated.

