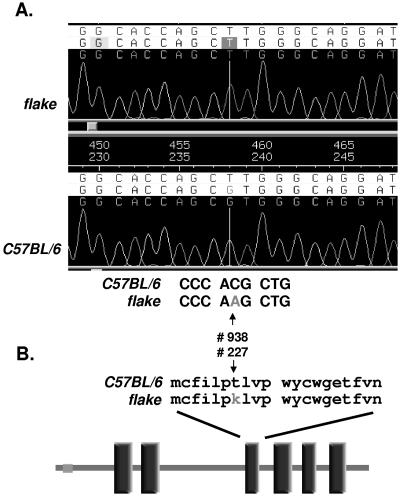
FIG. 4.
Molecular characterization of the flake mutation. (A) Trace file of amplified genomic DNA from homozygous flake mutant mice (top chromatogram) and normal animals (bottom chromatogram). (B) Schematic representation of the SCD1 protein and localization of the flake mutation. Vertical rectangles correspond to transmembrane domains predicted by SMART analysis.

