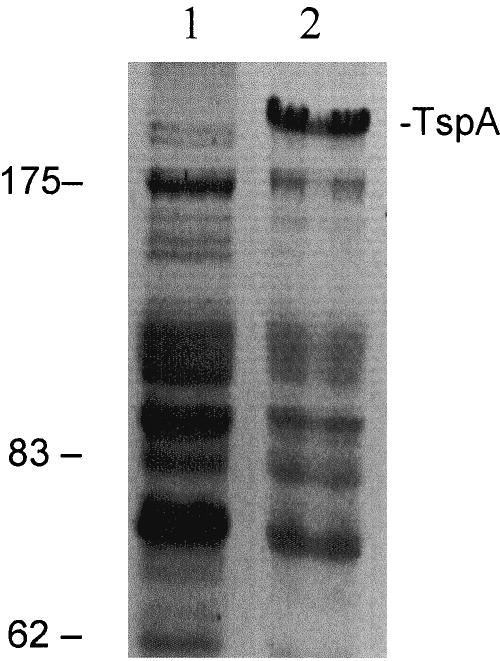
FIG. 1.
Gel electrophoresis protein profiles following expression of recombinant TspA: SDS-PAGE gel showing protein profiles of the control E. coli expression strain lysate (lane 1) and E. coli containing the TspA expression vector following induction to express TspA (lane 2). The positions of TspA and molecular weight markers (in kDa) are indicated on the right and left, respectively.

